

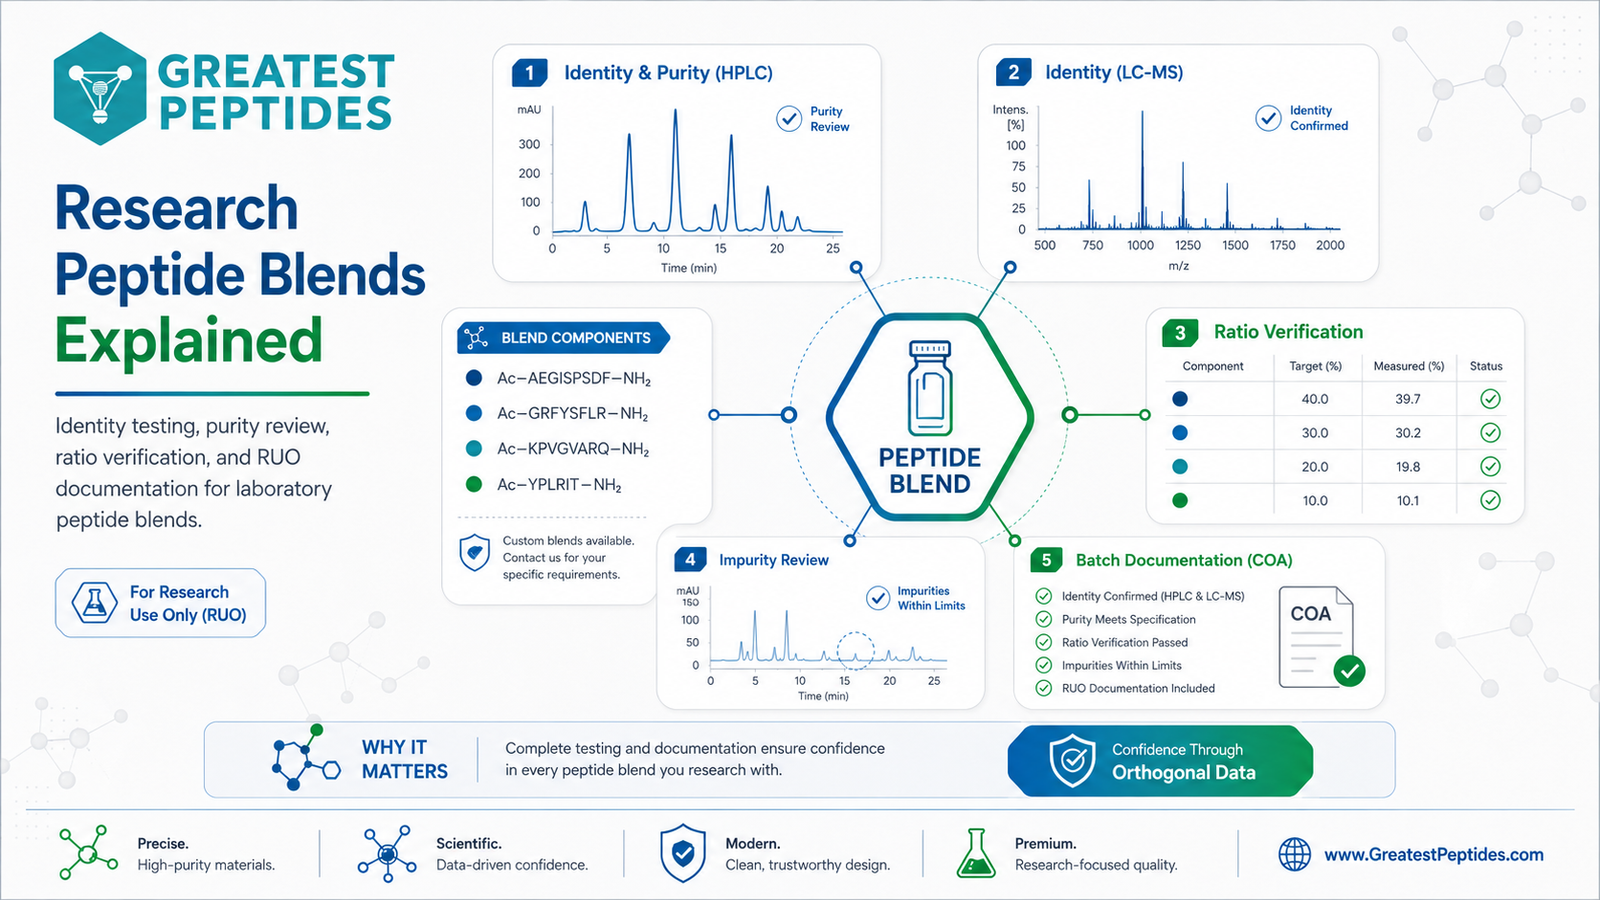
Multi-component peptide blends require the same documentation rigor as single compounds — applied to every constituent. This guide explains how RUO laboratories evaluate blends through identity testing, purity review, ratio verification, and COA documentation.
What a blend is
A research peptide blend combines two or more peptides in a single vial. Because the vial contains multiple compounds, the Certificate of Analysis must specify each constituent and its amount, not just a single purity figure.
Identity and purity (HPLC / LC-MS)
HPLC supports per-component purity assessment, while LC-MS or mass spectrometry supports identity confirmation against each peptide’s expected mass. For a blend, reviewers look for evidence that each named peptide is present and characterized.
Ratio verification
The relative amounts of each component define the blend. Documentation should make the ratio explicit so the material can be used consistently across a research program.
Batch documentation
A blend COA should list each compound, amount, lot number, test date, analytical method, and identity confirmation. Component list, amounts, method, and lot number are evaluated together, and the lot should match across the listing, label, and COA.
Research use only. Products discussed are intended strictly for in-vitro laboratory research and are not for human or veterinary use.
The short version
A blend is not a compound, it is a mixture with a label, and almost every difficulty it creates traces back to that one fact. The mass printed on the vial may be the total across all components or the amount of each one, and the two readings of the same number differ by a factor equal to the number of components. A single purity percentage, which is already only a ratio inside one chromatogram, becomes close to uninterpretable once several intended species are competing for area in the same trace. The proportions verified at fill are not automatically the proportions present at the bench, because the components dissolve, adsorb and degrade at different rates. And every concentration calculation now has to be run once per component off a single reconstitution volume. The sections below work through the specification conventions, the analytical problem, the drift mechanisms, the arithmetic, the comparison problem, and the study-design case for and against.
Total mass in the vial versus mass of each component
The single most consequential ambiguity in multi-component labeling is what the printed milligram figure is counting. A vial marked 70 mg can mean 70 milligrams of peptide in total, divided among three named compounds in some proportion the label does not state; or it can mean 70 milligrams of each named compound, for 210 milligrams in the vial. Both conventions exist in circulation. They are not close to each other, and nothing on the outside of the vial resolves which one is in use.
A related convention writes the components out individually, as in a listing that reads 5 mg and 5 mg. That form is unambiguous about the split but says nothing about the total unless the reader adds it up, and it invites a second mistake: treating the pair as one 10 mg unit when working out volumes. The arithmetic section below shows how quickly that compounds.
Underneath the total-versus-per-component question sit three further distinctions that also apply to single compounds but bite harder in a mixture, because each one can apply differently to each component. The first is salt form. Synthetic peptides are commonly isolated as trifluoroacetate or acetate salts, and the counterion contributes real weight. If one component in a blend is supplied as a TFA salt and another as an acetate, the gap between gross weighed mass and net peptide mass is not the same for the two, so the ratio by net peptide differs from the ratio by weighed powder.
The second is bulking agent. Lyophilized preparations frequently contain mannitol or a similar excipient to produce a cake that reconstitutes cleanly. Where an excipient is present and the label reports a single mass, that mass may or may not include it.
The third is nominal fill versus assayed content. The number on the label is usually a target fill weight. What the certificate reports, if it reports content at all, is what an assay found. The two are related by fill tolerance, residual moisture and whatever was lost to the vial walls, and for a mixture those losses are not necessarily proportional across components.
The practical consequence is that a blend label alone is not a specification. It is a name plus a number, and the specification lives on the certificate, if anywhere.
Readings of the same printed figure on a three-component vial
| Convention on the label | What a printed 70 mg means | What has to be asked |
|---|---|---|
| Total peptide, split not stated | 70 mg across all three, in unknown proportion | The mass or the percentage assigned to each named compound |
| Total peptide, split stated | 70 mg apportioned by a printed ratio such as 10:30:30 | Whether the ratio is by net peptide or by weighed powder |
| Mass per component | 70 mg of each, so 210 mg of peptide in the vial | Whether the vial volume and cake size are consistent with that much solid |
| Gross salt-form mass | Weighed powder including trifluoroacetate or acetate counterion | The net peptide content for each component separately |
| Mass including bulking agent | Total solid, of which some fraction is mannitol or similar | The excipient identity and how much of the cake it accounts for |
| Nominal fill weight | A target the filling step aimed at, not a measured quantity | Whether any content assay was run, and on which components |
None of these conventions is dishonest in itself. The failure is silence. A listing that states a total, names the components, gives the split, and says whether the figures are net peptide or salt-form mass has specified the material; a listing that prints one number and three names has not. When a supplier cannot answer the split question, the useful assumption is not a generous one. It is that the split was never established analytically, in which case the ratio is a manufacturing intention rather than a measured property of the lot in hand.
One percentage cannot describe a mixture
Area-percent purity works on a single-compound sample because there is one intended peak and everything else in the trace is, by definition, something that should not be there. A mixture destroys that assumption. Now there are several intended peaks, and the software has no way to know which of the remaining features are impurities of component A, impurities of component B, or component C sitting somewhere unexpected. A figure computed as main peak over total area is answering a question that no longer has a meaning.
Suppliers handle this in one of three ways, and the differences matter. Some report the area percent of the largest peak and label it purity, which guarantees a number lower than any of the components deserves and tells the reader nothing about the others. Some sum the areas of all named components and report that sum, which produces a flattering figure that can conceal a component being almost entirely absent. Some report nothing beyond the single-compound purity certificates for each raw material before blending, which describes the inputs rather than the vial.
Overlap is the deeper problem. Peptides that get blended together are often chosen for related reasons and are sometimes similar in size and hydrophobicity, which is exactly the condition under which reversed-phase retention times converge. Where two components co-elute the trace shows one peak, and one peak integrates as one component; the ratio between them is simply not present in the data. Partial overlap is worse in practice than complete overlap, because it looks resolvable and the split between the two areas then depends entirely on whether the analyst used a perpendicular drop or a tangent skim.
Masking runs in the other direction as well. A minor component present at a small fraction of the total sits low on the trace, and if it happens to elute near a large component it may be inside its tail rather than beside it. An impurity of one component can also land on top of another component and be counted as that component, inflating the apparent amount of a compound that is actually short.
Detection compounds this. Where the components differ in chromophore content, their response factors at the monitored wavelength differ too, so peak areas are not proportional to mass across components even when everything resolves cleanly. A copper-containing component behaves differently again in the ultraviolet from a plain peptide.
What a blend actually needs is a per-component assay: each named compound quantified against its own reference standard, with its own purity stated separately, and the separation demonstrated to resolve all named components from one another.
What a single area-percent figure does and does not survive in a mixture
| Chromatographic situation | What the trace shows | What one percentage implies |
|---|---|---|
| All components baseline resolved | One peak per named compound plus impurity peaks | Still ambiguous: the reader cannot tell which peak the figure refers to |
| Two components partly overlapping | A merged pair with a valley or a shoulder | The split depends on drop-line versus tangent skim, not on the material |
| Two components fully co-eluting | A single peak carrying two compounds | The ratio between them is absent from the data entirely |
| Minor component inside a major peak tail | No distinguishable feature at the expected time | Reads as the minor component being absent, or as tail area of the major one |
| An impurity of A co-eluting with B | A peak at the retention time expected for B | Inflates apparent B content and hides a defect in A |
| Components with unequal ultraviolet response | Peak areas not proportional to mass across compounds | Any ratio read off area percent is systematically skewed |
The test to apply to a blend certificate is whether the document distinguishes its components anywhere. If the only quantitative statement is one number with a percent sign, that number was computed by a routine that assumed a single analyte and was handed a mixture. It is not that the figure is slightly optimistic. It is that no arithmetic connects it to the composition of the vial. A certificate showing separate retention times, separate identity confirmations and separate content figures for each named compound is describing the material; one showing a single percentage is describing a calculation.
Component proportions do not stay where the fill put them
Suppose the proportions were established analytically in bulk solution before filling. That measurement is genuine and it is still not a statement about what is in a particular vial at the moment someone reconstitutes it, because several processes between those two points act on the components unequally.
Filling itself is the first. A bulk solution is homogeneous, but the transfer into vials involves lines, needles and surfaces, and peptides adsorb to surfaces at different rates depending on charge and hydrophobicity. A strongly surface-active component is depleted slightly more than an inert one across a filling run, and the first and last vials of a run are not always identical.
Lyophilization acts next. The cake forms as ice sublimes, and the components do not necessarily distribute uniformly through it. Freeze concentration during the freezing step can push solutes into different regions of the forming ice matrix, and where a cake collapses, cracks or splashes up the vial wall, the fraction that ends up on the shoulder of the vial may not have the same composition as the fraction at the bottom. Residual moisture also distributes unevenly through a cake, which matters because moisture drives hydrolysis and deamidation at different rates for different sequences.
Storage is where the largest divergence usually accumulates, because degradation rates are sequence-specific. A component carrying a methionine oxidizes on a different timescale from one that does not. A sequence with an asparagine-glycine motif deamidates faster than one without. A metal complex behaves differently again from a plain peptide, and can catalyze oxidation of material around it. Two compounds sealed in the same vial under identical conditions therefore lose potency at different rates, and the ratio at twelve months is not the ratio at fill even if nothing went wrong.
Reconstitution is the last and most immediate mechanism. Components differ in solubility, and a cake that has partly collapsed or has been stored warm can contain material that goes into solution slowly or incompletely. If one component dissolves fully in thirty seconds and another needs several minutes of standing, an aliquot drawn early carries a different ratio from one drawn after full dissolution. Adsorption to the vial glass and the stopper continues in solution, and again it is component-specific, which is why a blend held in solution for days is a different mixture from the one first reconstituted.
The conclusion is narrow but firm: a ratio is a property of a lot at a time under a storage history, not a permanent attribute of the product name.
Mechanisms that move a verified proportion, and when each one acts
| Mechanism | Stage at which it acts | Effect on the proportion |
|---|---|---|
| Differential surface adsorption in the fill line | Filling | Depletes the more surface-active component across a run; vial-to-vial spread |
| Non-uniform cake formation and splashing | Freezing and drying | Composition varies between regions of the same cake |
| Uneven residual moisture through the cake | Drying and storage | Drives hydrolysis and deamidation faster in some regions than others |
| Sequence-specific oxidation and deamidation | Storage of the dry solid | The less stable component declines first; the ratio shifts with shelf time |
| Incomplete or slow dissolution of one component | Reconstitution | An aliquot drawn early carries a different ratio than one drawn later |
| Adsorption to glass and stopper in solution | After reconstitution | Continues over days and is component-specific; the minor component suffers most |
| Freeze-thaw of a reconstituted blend | Repeat handling | Aggregation and loss affect components unequally; the ratio drifts each cycle |
The practical handling consequences are ordinary rather than exotic. Allow full dissolution with gentle swirling before drawing anything, since the ratio in a partly dissolved vial is not the ratio on the label. Prepare a working solution once rather than repeatedly returning to the same vial over weeks. Record the reconstitution date alongside the lot, because for a mixture the elapsed time in solution changes the composition and not just the total potency. And treat a stability statement that covers only one named component as covering only that component.
Working out per-component concentration from one diluent volume
All of the measurement arithmetic for a blend follows from one structural fact: there is a single reconstitution volume and several masses sharing it. Every concentration must therefore be computed once per component, and the volume drawn for a target amount of one component is fixed by that component alone, with the others coming along at whatever amounts their own concentrations dictate.
The base relation is unchanged. Concentration equals mass divided by volume, so a component present at mass m milligrams in a vial reconstituted with V milliliters is at m divided by V milligrams per milliliter. The volume needed to deliver a target research amount t of that component is t divided by its concentration. What changes in a mixture is that this must be run separately for each named compound, and that only one of those targets can be chosen freely.
Take a vial labeled as two components at 5 mg and 5 mg, reconstituted with 2.00 mL of bacteriostatic water. Each component is at 2.5 mg/mL, and the total peptide concentration is 5 mg/mL. An aliquot of 0.20 mL, which is the 20-unit graduation on a U-100 barrel marked in hundredths of a milliliter, carries 0.5 mg of each. Notice that the total peptide concentration, 5 mg/mL, is the number a reader gets by treating the vial as a 10 mg unit, and using it in place of the per-component figure overstates each component by a factor of two.
Now take a three-component vial with a stated 70 mg total split 10, 30 and 30, reconstituted with 5.00 mL. The concentrations are 2, 6 and 6 mg/mL respectively, and total peptide is 14 mg/mL. A 0.25 mL aliquot, 25 units, carries 0.5 mg of the first component and 1.5 mg of each of the other two. The ratio is fixed by the vial; the only variable under the researcher's control is the volume, and moving it scales all three together.
This is where the specification problem from the first section becomes an arithmetic problem. If the label states 70 mg with no split, the total concentration is computable and every per-component concentration is not. A researcher can honestly write 14 mg/mL of total peptide on the tube label and cannot honestly write anything per component. That is not a rounding issue, it is a missing input.
Two conventions are worth adopting for mixtures. Write the concentration of every named component on the working-solution label, not the total. And where a run needs a specific amount of one compound, state which compound the volume was calculated from, since the same volume will be an unexceptional figure for one component and an unusual one for another.
Worked per-component arithmetic for hypothetical two- and three-component vials
| Vial as labeled | Diluent added | Per-component concentration | Aliquot for a 0.5 mg target of the first component |
|---|---|---|---|
| 5 mg + 5 mg, two components (10 mg total) | 2.00 mL | 2.5 mg/mL each; 5 mg/mL total peptide | 0.20 mL, the 20-unit mark; carries 0.5 mg of the second component too |
| 5 mg + 5 mg, two components (10 mg total) | 1.00 mL | 5 mg/mL each; 10 mg/mL total peptide | 0.10 mL, the 10-unit mark; same 1:1 pairing at half the volume |
| 10 mg + 2 mg, two components (12 mg total) | 2.00 mL | 5 mg/mL and 1 mg/mL | 0.10 mL, the 10-unit mark; carries 0.10 mg of the minor component |
| 10 mg + 10 mg + 10 mg (30 mg total) | 3.00 mL | 3.33 mg/mL each; 10 mg/mL total peptide | 0.15 mL, the 15-unit mark; carries 0.5 mg of each of the other two |
| 10 mg + 30 mg + 30 mg (70 mg total) | 5.00 mL | 2, 6 and 6 mg/mL; 14 mg/mL total peptide | 0.25 mL, the 25-unit mark; carries 1.5 mg of each of the other two |
| 70 mg total, split not stated | 5.00 mL | 14 mg/mL total peptide; per-component values indeterminate | Cannot be calculated until the split is supplied |
The last row is the one to hold onto. Every other row in the table is elementary arithmetic that anyone can check in a few seconds; the last is not arithmetic at all, because an input is absent. A mixture whose split is unstated cannot be used quantitatively for anything that depends on the amount of a particular compound, no matter how carefully the volumes are measured. The only honest description of such a vial is its total peptide concentration, and the only honest use of it is one in which the identity of the individual components does not enter the calculation.
Why two blend listings resist direct comparison
Comparing two single-compound offerings is mostly a matter of comparing two purity figures and two identity confirmations for the same named molecule. Comparing two mixtures is a different exercise, because almost every variable that could differ does differ, and several of them are invisible from the outside.
Start with what is being compared. Two vials sharing a product name may hold different total masses, different splits, different salt forms and different excipient loads, and each of those changes the amount of each active component that a given volume carries. A vial with a larger printed number is not necessarily the one carrying more of the compound of interest, since the compound of interest may be the minor member of one blend and the major member of the other.
Then there is the analytical layer. Even where both suppliers publish chromatograms, a purity or content figure for a mixture depends on whether the method resolves the named components from one another, and two methods that are both reasonable can resolve different subsets. A steeper gradient merges components that a shallower one separates, which for a mixture does not just raise a purity number, it changes which compounds are being counted as which. Comparing a supplier who quantified each component against its own reference standard with one who reported the largest peak in the trace is not comparing like with like at all.
The third layer is the ratio claim itself. A stated ratio can be an intended formulation ratio, a ratio measured in bulk before filling, or a ratio measured in the finished vial. Those are three different claims of increasing strength and they are frequently written identically.
The documentation a mixture needs is correspondingly larger than what a single compound needs, and this is the most useful axis on which to compare two suppliers. A single-compound certificate can be adequate with an identity confirmation, a purity figure with method, a content or assay figure, a lot number and a date. A mixture needs all of that once per named component, plus a statement of the ratio and how it was established, plus evidence that the separation used can actually resolve the components it is quantifying, plus lot traceability that reaches back to the individual input materials rather than stopping at the blended lot.
That last point deserves weight. A blended lot has parent lots. Where a certificate names only the blend lot, a defect traced later to one input material cannot be scoped, because there is no record of which finished vials contain it.
Certificate fields: single compound versus multi-component preparation
| Field | On a single-compound certificate | What a mixture additionally requires |
|---|---|---|
| Identity | One mass confirmation against the expected molecular weight | A separate confirmation for every named component, each at its own retention time |
| Purity | One area percent with the method stated | A purity figure per component, plus proof the method resolves them from each other |
| Content or assay | Net peptide content against a reference standard | A content figure per component, each against its own reference standard |
| Composition | Not applicable | The mass or percentage of each component and whether it is net peptide or salt form |
| Ratio provenance | Not applicable | Whether the ratio is intended, measured in bulk, or measured in the finished vial |
| Lot traceability | One lot number matching label and records | The blended lot plus the parent lot of each input material |
| Stability statement | Storage conditions and a retest or expiry date | Which component the statement was established on, since they do not decline together |
Working down that table is a faster way to compare two suppliers than reading either listing in full. Count how many of the seven fields each document actually populates per component rather than per vial. A certificate that answers all seven describes a mixture; one that answers the first two at the vial level has described something closer to a raw material. The gap between those two documents is usually far larger than any difference in the percentages printed on them, and it is the gap that determines whether the material can support quantitative work.
Confounded variables and when a mixture is still the right material
The design objection to mixtures is straightforward and it is not a matter of quality. If a preparation contains three compounds and an observation is made, the observation cannot be attributed to any one of them. It could belong to any component, to a combination of two, to the full set acting together, or to an interaction in which one component changes the behavior of another. A single experimental arm carrying a mixture yields a single fact about that mixture and no facts about its constituents.
This matters most when the intent is to connect an observation back to published literature, because that literature is almost entirely on single compounds. A model in which a three-component preparation is applied cannot be compared with a paper in which one of those three was applied alone, and any inference drawn across that gap is assuming exactly what the experiment failed to isolate. The problem compounds when the ratio in the vial differs from any ratio the literature examined, which is usually the case, since blend ratios are commercial conventions rather than findings.
Concentration-response work is affected the same way. Scaling the aliquot volume scales every component together, so the resulting curve is a curve in one variable that is really a fixed-proportion path through a multi-dimensional space. It cannot distinguish a component that is driving the response across the whole range from one that contributes nothing, and it cannot detect a component whose contribution reverses direction partway along. Separating those requires arms in which the components vary independently, which means single-component materials.
There are situations where a mixture is nonetheless the correct material, and they share a feature: the mixture itself is the object of study rather than a convenient way to deliver several things at once. Formulation compatibility work asks whether these compounds can coexist in one vessel without one degrading the other, and that question requires them to be in one vessel. Stability studies on co-formulated material are the same case. Method development for a per-component assay needs a genuine mixture to develop against. And a screening stage that is explicitly asking whether a combination is worth decomposing into arms at all can reasonably start with the combined preparation, provided the follow-up arms are planned.
The distinction worth carrying is between using a mixture because the mixture is the question, and using a mixture because it was what the catalog had. The first is a design choice. The second is a confound acquired by accident, and it is usually discovered at the point where the data has to be written up.
Whether a multi-component preparation suits the aim
| Aim of the work | Suitable material | Reason |
|---|---|---|
| Attributing an observation to one compound | Single compounds, one per arm | A mixture provides no way to assign the observation to a component |
| Building a concentration-response relationship for one compound | Single compound | Scaling the aliquot moves every component together along a fixed ratio |
| Comparing against published single-compound literature | Single compound at a comparable concentration | The literature comparison assumes the isolation the mixture removes |
| Testing whether two compounds interact | Both singles plus the combination, all four arms | Interaction is defined against the single-component arms; the mixture alone is one point |
| Assessing whether compounds can be co-formulated | The mixture | Degradation of one component by another only occurs in the shared vessel |
| Stability of a co-formulated preparation over time | The mixture, sampled at intervals | The question is about the mixture as supplied |
| Developing a per-component assay method | The mixture, plus each single as a reference | Resolution between components can only be demonstrated on a real mixture |
A mixture is a convenience for whoever fills the vial and a constraint for whoever uses it. That trade is worth making when the combined preparation is what the study is about, and it is a poor trade when the study is really about one component and the mixture was chosen because it was available. Where the aim is attribution, the same compounds bought separately cost more handling and more vials, and they preserve the one property that makes an observation interpretable, which is knowing what changed.
Questions this guide gets asked
If the label says 70 mg and lists three peptides, how much of each is present?
There is no way to determine that from the label. The figure may be the total across the three, in which case each component holds some unstated share of 70 mg, or it may be the amount of each, giving 210 mg in the vial. Even where the total reading is correct, an even three-way split is an assumption rather than an inference; commercial blends are frequently uneven. The answer has to come from the certificate, which should state either a mass or a percentage per named component and say whether those figures are net peptide or salt-form mass. Until that is supplied, the only defensible quantitative statement about the vial is its total peptide content.
Can a single purity percentage be meaningful for a multi-component vial?
Only in the narrow sense that some number was computed. Area percent divides one peak area by the sum of all integrated areas, which presumes one intended analyte. Handed a mixture, the routine either reports the largest component and understates everything, or sums the named components and conceals one being nearly absent. Neither figure connects arithmetically to the composition of the vial. What a mixture needs is a purity figure per component, each with its own retention time, together with evidence that the separation resolves the named compounds from one another. Where components co-elute, the ratio between them is simply not recoverable from that chromatogram at all.
Does a ratio verified at manufacture still hold when the vial is opened?
Not necessarily, and the gap widens with shelf time. Components adsorb to fill lines and vial surfaces at different rates, distribute unevenly through a lyophilized cake, and degrade on sequence-specific timescales, so a component prone to oxidation or deamidation declines faster than a stable one sitting beside it. Reconstitution adds a further step, since components differ in how quickly and completely they dissolve, and an aliquot drawn before full dissolution carries a different proportion than the label states. A ratio is therefore a property of a particular lot at a particular age under a particular storage history, not a fixed attribute of the product name.
How is the volume to draw calculated when the vial holds several compounds?
Run the calculation once per component. Divide each component mass by the single reconstitution volume to get its own concentration in milligrams per milliliter, then divide the target research amount of whichever compound the work is anchored on by that compound's concentration. The volume that produces is fixed, and the other components arrive at whatever amounts their own concentrations give. For a vial of two components at 5 mg each reconstituted with 2.00 mL, both are at 2.5 mg/mL and a 0.20 mL aliquot carries 0.5 mg of each. Treating that vial as a single 10 mg unit gives 5 mg/mL and overstates each component twofold.
Why is it harder to compare mixtures across suppliers than single compounds?
Because more variables differ and fewer of them are visible. Two vials sharing a name can hold different totals, different splits, different salt forms and different excipient loads, so the amount of the compound of interest per milliliter is not comparable even before analysis enters. On the analytical side, one supplier may quantify each component against its own reference standard while another reports the largest peak in a trace whose method may not even resolve the components. And a stated ratio may be an intended formulation figure, a bulk measurement, or a finished-vial measurement, three claims of very different strength that are usually written the same way.
When is a multi-component preparation the right material to work with?
When the mixture itself is the subject of the investigation rather than a convenient package. Compatibility work, asking whether these compounds coexist in one vessel without one degrading another, requires them in one vessel. Stability studies on co-formulated material are the same case. Developing an assay that separates and quantifies each component needs a genuine mixture to develop against. A screening stage explicitly planned to be decomposed into single-component arms later is defensible too. What does not work is using a mixture when the question concerns one component, because nothing in the data will distinguish that component's contribution from the others.
Where to read next
- BPC-157 and TB-500 as a research combination the single-compound literature behind a commonly combined pair
- How to reconstitute a research peptide, step by step the base concentration arithmetic this guide runs once per component
- Peptide purity versus peptide identity for research labs why an area percentage and a mass match answer different questions
- Three-component research preparation, 70 mg listing check the per-component breakdown on the batch certificate
- Third-party lab testing and certificates
All materials referenced here are supplied strictly for laboratory research use. They are not drugs, foods, cosmetics or medical devices, and they are not for human or veterinary use, diagnostic use, or any form of consumption. The worked figures above are measurement arithmetic for preparing laboratory aliquots from hypothetical vials and are not guidance for use of any kind. Composition figures should always be read from the certificate supplied with the specific lot in hand.