

Peptide purity and peptide identity are related but separate analytical attributes. Purity describes how much of a sample is the target compound; identity confirms that the target compound is actually what the label says it is. For research-use-only (RUO) laboratory work, both belong on a serious certificate of analysis (COA) review.
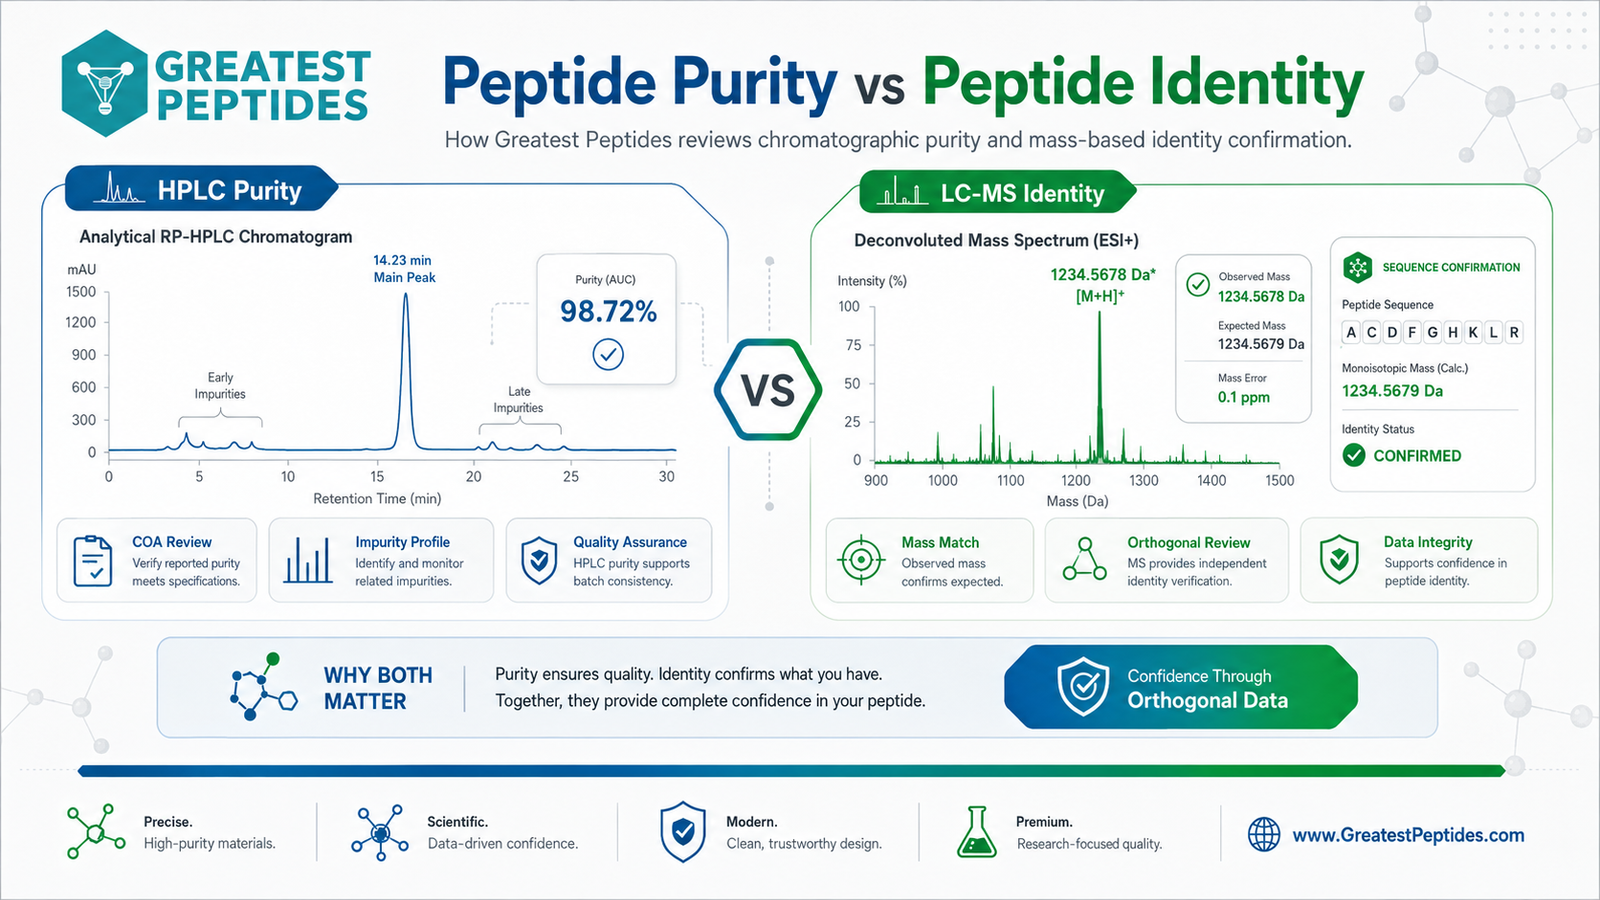
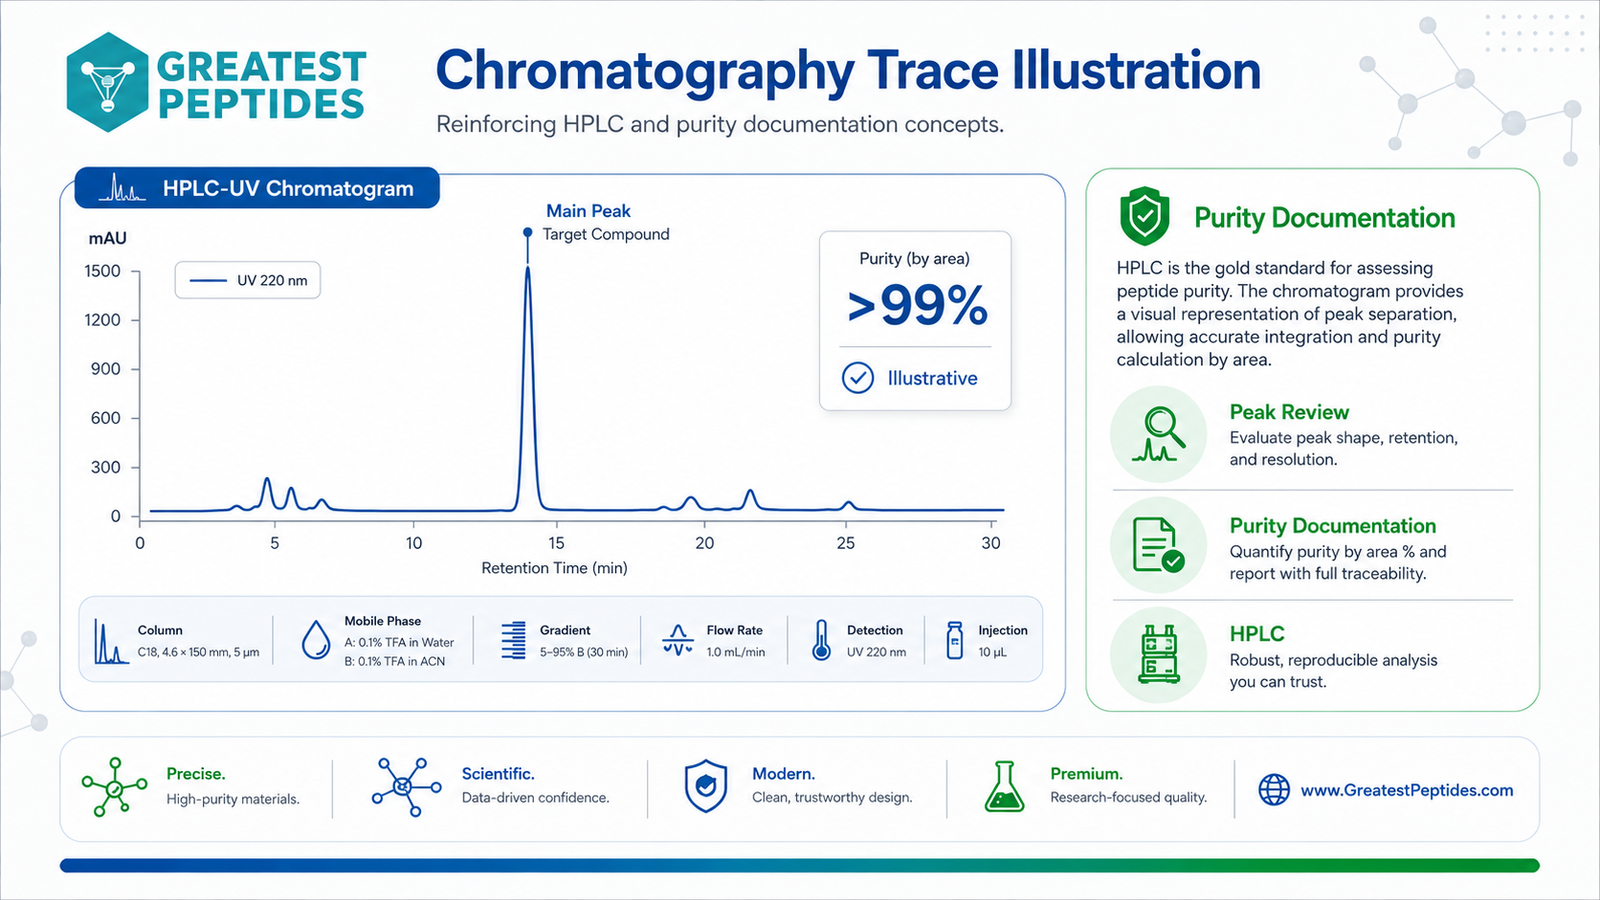
HPLC purity
Reversed-phase HPLC is the standard method for assessing peptide purity. The chromatogram separates the target peptide from related impurities, and purity is calculated as the area percent of the main peak. Reviewers evaluate peak shape, retention time, and the impurity profile.
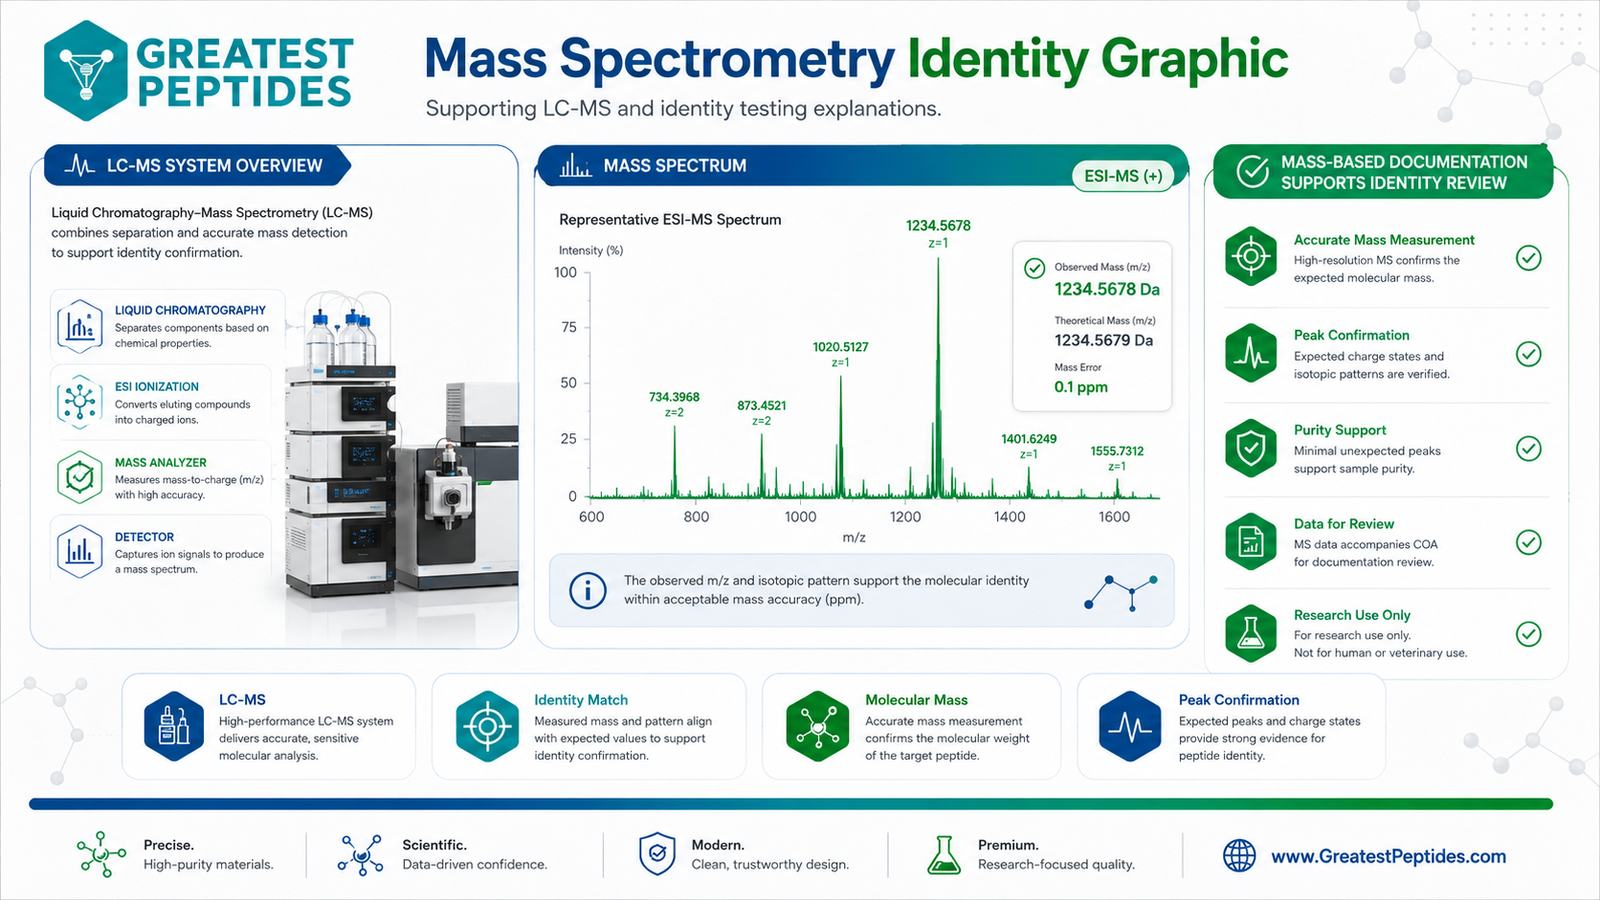
LC-MS identity
Liquid chromatography coupled with mass spectrometry (LC-MS) provides an orthogonal, mass-based confirmation of identity. The observed mass is compared to the expected (theoretical) mass within a tight ppm error, and isotopic patterns and charge states support the assignment.
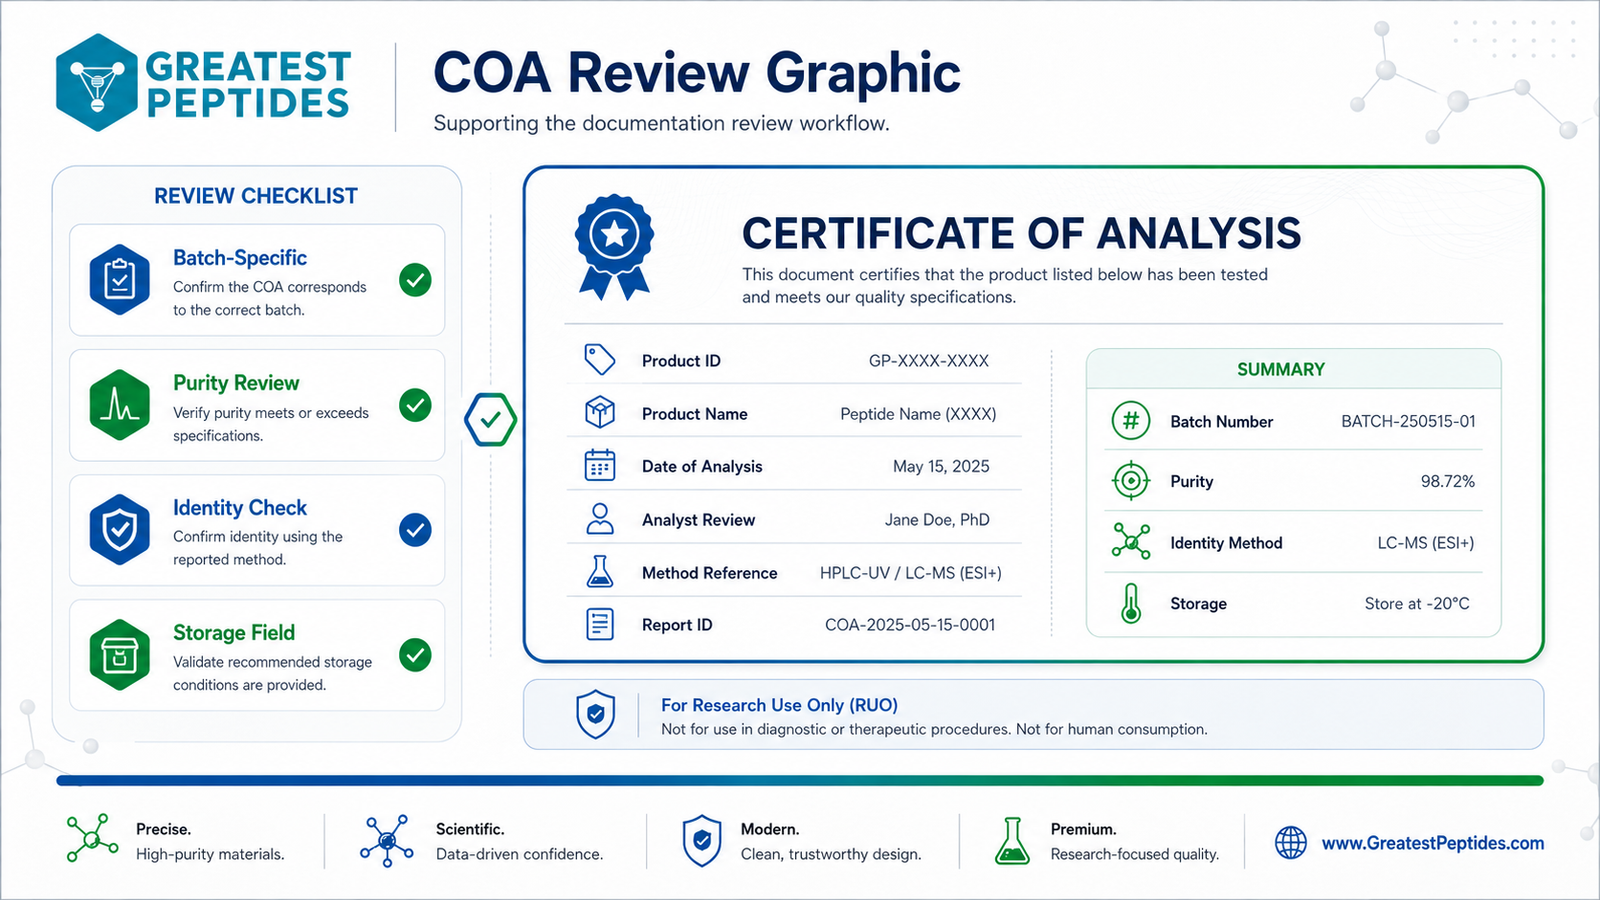
COA review
A COA ties the analytical data to a specific production lot. A documentation-first review confirms the COA is batch-specific, that purity meets specification, that identity was confirmed by an approved method, and that storage conditions are stated.
Lot traceability
Traceability connects the product label, the COA, the receiving log, and the inventory record through a shared lot number. That chain is what makes a research result auditable.
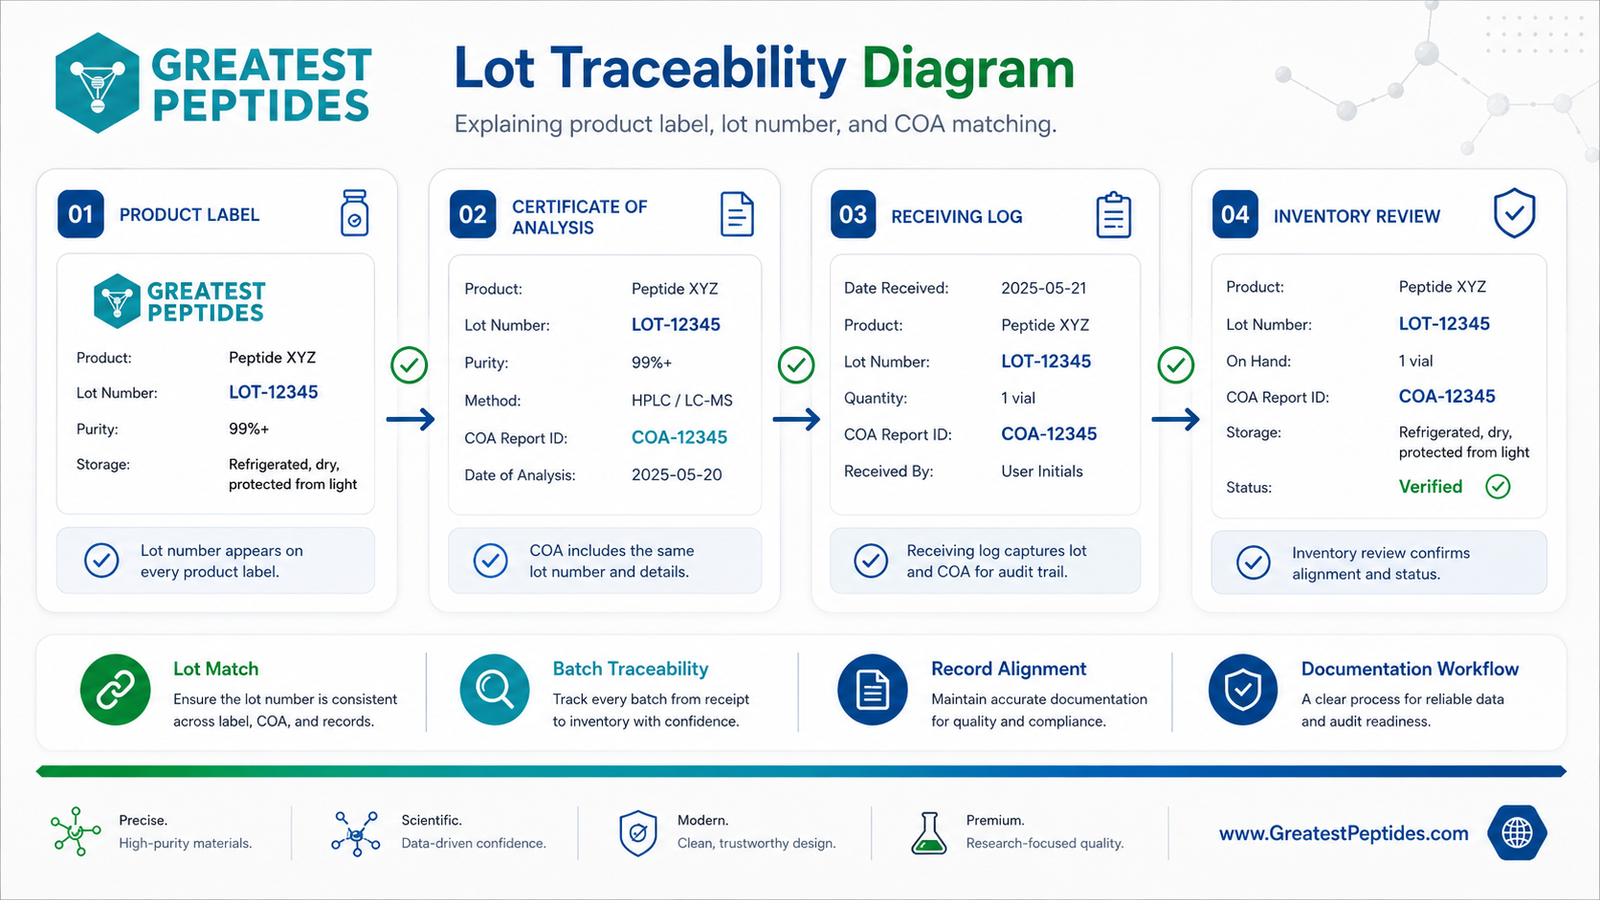
Research use only. Products discussed are intended strictly for in-vitro laboratory research and are not for human or veterinary use.
The short version
Purity and identity answer two different questions, and a certificate that answers only one of them leaves a real gap. Purity asks how much of the material in the vial is the peak you care about, expressed as a percentage of integrated area under a chromatogram. Identity asks whether that peak is actually the molecule named on the label, which is a mass question, not an area question. A lot can be 99.4 percent pure and still be the wrong compound, because purity arithmetic is blind to what the dominant peak is made of. The practical consequence for a receiving lab is that the two figures have to be read together, in that order, and neither one substitutes for the other. The sections below cover how each number is produced, where each one fails, what a complete document set looks like, and what to do when the two disagree.
Why the two numbers cannot be collapsed into one
It is tempting to treat a certificate of analysis as a single quality score, and vendors sometimes encourage that by leading with one large percentage. But the two figures come from physically different measurements on different instruments, and they answer questions that do not overlap.
A purity figure is an area ratio. A sample is separated on a reversed-phase column, a detector records absorbance against time, and software integrates the resulting peaks. The main peak's area is divided by the total integrated area, and the result is reported as a percentage. Nothing in that calculation inspects the chemical composition of any peak. The arithmetic would produce the same 99.2 percent whether the main peak is the target sequence, a closely related deletion sequence, or an entirely different molecule that happens to elute at a similar retention time under those conditions.
An identity figure is a mass measurement. The material is ionized and its mass-to-charge ratio is measured, then compared against the mass predicted from the stated amino acid sequence. A match within instrument tolerance is evidence that the molecule present is the one named. That measurement says nothing about how much else is in the vial, because a trace contaminant and a major contaminant both produce peaks; the mass spectrum establishes what is there, not what fraction of the material it represents.
Read in the wrong order, this produces a specific and common error: a high-purity number is taken as confirmation of the label. It is not. High purity with no identity confirmation means the lot is homogeneous, which is a real and useful property, but homogeneity is not identity.
The two questions, side by side
| Purity | Identity | |
|---|---|---|
| Question answered | How much of the material is the main peak? | Is the main peak the named molecule? |
| Typical method | RP-HPLC with UV detection at 214 or 220 nm | ESI-MS or MALDI-TOF, sometimes LC-MS |
| Result format | Percentage of total integrated area | Observed mass vs theoretical mass |
| What it cannot tell you | What the main peak is | What fraction of the vial the peak represents |
| Failure it catches | Incomplete synthesis, residual reagents, degradation | Wrong sequence, wrong salt form, mislabeled lot |
The right mental model is a two-key lock. Identity establishes that the material is what the label claims. Purity establishes how much of the vial is that material rather than something else. Turning one key does not open anything on its own.
How a purity percentage is actually produced
Understanding where the number comes from is what makes it possible to read critically, because several defensible analytical choices move the figure by a percentage point or more without any change in the material.
Detection wavelength matters. Peptide bonds absorb strongly near 214 nm, which makes that wavelength close to universal for peptides and relatively even across different sequences. A method run at 254 nm or 280 nm instead is biased toward whatever in the sample carries aromatic residues, which means some impurities become nearly invisible and the purity figure rises. A certificate that omits the detection wavelength has omitted a variable that materially affects the answer.
Gradient and run length matter. A steep, short gradient pushes structurally similar species toward co-elution, and species that co-elute are integrated as one peak. That inflates the main peak's share. A shallower gradient over a longer run resolves those neighbors into separate peaks and the reported purity drops, even though nothing about the sample has changed. This is why comparing purity numbers across vendors is only meaningful when the methods are comparable, and most certificates do not publish enough method detail to make that comparison honest.
Integration choices matter. Where the baseline is drawn, whether small peaks near the solvent front are included or excluded, and how shoulders on the main peak are split all shift the arithmetic. Reputable certificates include the chromatogram image so a reader can see the baseline and judge whether the integration is reasonable. A certificate that reports a percentage with no chromatogram is asking to be taken on trust.
Injection concentration matters at the margins. Overloading the column broadens and tails the main peak, which can bury small impurities under the tail. An underloaded injection may put genuine trace impurities below the detection limit, so they simply do not appear and do not count against the total.
Method variables that move a purity figure without changing the material
| Variable | Direction of effect | What to look for on the certificate |
|---|---|---|
| Detection wavelength | Longer wavelengths generally raise the figure | An explicit wavelength, ideally 214 or 220 nm |
| Gradient steepness | Steeper gradients raise the figure | Stated gradient and total run time |
| Run length | Shorter runs raise the figure | A chromatogram whose main peak is not near the end |
| Baseline placement | Aggressive baselines raise the figure | A visible, printed chromatogram |
| Injection load | Overload can hide small impurities | Peak shape that is symmetrical, not flat-topped |
None of this means purity figures are meaningless. It means the figure is a method-dependent measurement, and a certificate that hides the method is reporting a number that cannot be checked.
How an identity confirmation is actually produced
Identity confirmation compares an observed mass against a theoretical mass calculated from the stated sequence. The comparison sounds simple and usually is, but three details decide whether a given confirmation is strong or weak.
The first is which mass is being reported. A monoisotopic mass is calculated from the most abundant isotope of each element and is the appropriate reference for high-resolution instruments. An average mass is weighted across natural isotope abundance and is appropriate for lower-resolution work. For a peptide of a few thousand daltons the two differ by roughly one to two units, which is large enough that a certificate reporting an observed mass against the wrong theoretical basis can look like a mismatch when the material is correct, or like a match when it is not.
The second is charge state. Electrospray ionization typically produces multiply charged ions, so the raw spectrum shows a series of peaks rather than a single mass. Software deconvolutes that series back to a neutral mass. A certificate that reports an observed value near the theoretical mass has already done the deconvolution; one that reports a raw m/z leaves the reader to work out which charge state was observed. Neither is wrong, but they are not interchangeable and should not be compared directly.
The third is tolerance. High-resolution instruments routinely achieve accuracy in the low parts-per-million range, while a benchtop instrument may be accurate to a fraction of a dalton. A stated tolerance turns the comparison into a pass or fail test. A certificate with no tolerance leaves the reader guessing whether a two-dalton discrepancy is instrument noise or a real structural difference, and for many peptides a shift of that size corresponds to a meaningful change, such as an oxidation or a difference in the number of disulfide bonds.
What a strong identity confirmation states explicitly
| Element | Weak certificate | Strong certificate |
|---|---|---|
| Theoretical mass | Absent or unlabeled | Stated, with monoisotopic or average specified |
| Observed mass | A number with no context | Deconvoluted neutral mass, or m/z with charge state |
| Tolerance | Not mentioned | An explicit window the result is judged against |
| Instrument | Not mentioned | Ionization mode and analyzer type named |
| Sequence basis | Only the trade name given | Full sequence printed so the mass can be recalculated |
The last row deserves emphasis. If the full sequence is printed on the certificate, an independent reader can calculate the theoretical mass and check the vendor's arithmetic. If only a trade name appears, the reader is trusting both the measurement and the vendor's mapping from name to sequence, and that mapping is exactly where a mislabeling error would live.
The failure modes each measurement is blind to
Both methods have well-characterized blind spots. Knowing them is what turns a certificate from a formality into a usable screening tool.
Purity is blind to isobaric species. Two molecules with the same mass but different structure are distinguished by neither a mass measurement nor an area calculation, and if they also co-elute, chromatography does not separate them either. Sequence isomers, which contain the same residues in a different order, are the textbook case. Detecting them requires fragmentation, meaning tandem mass spectrometry, which is rarely included in a routine certificate.
Purity is also blind to anything that does not absorb at the detection wavelength. Residual salts from cleavage and lyophilization, and counterions associated with the peptide, contribute mass to the vial but little or no absorbance. This is why a peptide content or net peptide assay exists as a separate figure: it reports what fraction of the weighed powder is peptide rather than salt and water, and it is routinely much lower than the HPLC purity figure. A certificate showing 99 percent purity and no peptide content figure is silent about how much of the mass in the vial is the compound at all.
Identity is blind to quantity. A mass spectrum confirming the target sequence is present says nothing about whether it is 99 percent or 40 percent of the material, because the ionization efficiency of different species varies and peak intensity in a mass spectrum is not a reliable proxy for abundance.
Identity is also weak against closely related truncations when the instrument resolution is low. A sequence missing a single small residue differs from the target by a modest mass increment, and on a low-resolution instrument with a generous tolerance window that difference can fall inside the accepted range.
Blind spots and what closes them
| Blind spot | Which method misses it | What would catch it |
|---|---|---|
| Sequence isomers | Both | Tandem MS with fragmentation |
| Residual salts and counterions | HPLC purity | Peptide content or net peptide assay |
| Water content | Both | Karl Fischer or loss on drying |
| Relative abundance of the target | Identity | HPLC purity read alongside |
| Single-residue truncations | Low-resolution identity | High-resolution MS with a tight tolerance |
| Endotoxin and bioburden | Both | Separate assays, rarely on a standard certificate |
The pattern across that table is that a two-figure certificate covers a narrow band of possible problems well and says nothing at all about several others. That is not a criticism of the certificate; it is a reason to know what the document does and does not cover before treating it as a complete record.
What to do when purity and identity disagree
Disagreement is informative, and the shape of the disagreement points toward different explanations.
High purity with a failed or absent identity check is the most concerning combination. The material is homogeneous, so it is probably a single compound made competently, but there is no evidence it is the compound on the label. This is the signature of a labeling or lot-tracking error rather than a synthesis error. The reasonable response is to request the mass spectrum for the specific lot number on the vial and to compare the theoretical mass against one calculated independently from the published sequence.
Confirmed identity with low purity is more ordinary. The right molecule is present but accompanied by a meaningful fraction of something else, usually truncated or deletion sequences from incomplete coupling during synthesis, or degradation products that formed after synthesis. Whether that matters depends entirely on the intended experiment, but it should be a decision made knowingly rather than discovered later.
Both figures strong but the documents inconsistent is a records problem rather than a chemistry problem, and it is the most commonly overlooked of the three. If the lot number on the certificate does not match the lot number on the vial, or the analysis date precedes the stated manufacturing date, or the compound name on the chromatogram header differs from the name in the summary table, the document set does not establish anything about the material actually in hand. The chemistry may be perfect and the paperwork still fails to connect it to that vial.
Reading the disagreement
| Pattern | Most likely explanation | Reasonable next step |
|---|---|---|
| High purity, no identity data | Labeling or lot-tracking error | Request lot-specific mass spectrum |
| Identity confirmed, purity below spec | Incomplete synthesis or degradation | Request the chromatogram and impurity table |
| Both strong, lot numbers mismatched | Records error | Request the certificate matching the vial lot |
| Both strong, no analysis date | Certificate reused across lots | Request a dated, lot-specific document |
| Purity stated without a chromatogram | Unverifiable integration | Request the raw chromatogram image |
In every row the next step is a document request rather than a judgment about the material. That is deliberate. A certificate gap is a documentation problem until proven otherwise, and most of them resolve into a records issue that a supplier can close by sending the right file.
Building a receiving checklist that uses both figures
A receiving procedure that treats the certificate as a checklist rather than a score catches most of the problems described above without any instrumentation of its own. The order matters, because each step is only meaningful if the previous one passed.
Start with the connection between paper and vial. Confirm the lot number on the certificate matches the lot number printed on the container, and that the compound name and stated amount match. If that link is broken, nothing further in the document tells you anything about the material in front of you.
Next confirm identity. Locate the observed mass and the theoretical mass, note whether they are monoisotopic or average, and check that the difference falls within a stated tolerance. If the full sequence is printed, recalculate the theoretical mass independently rather than accepting the vendor's figure.
Only then read purity. Find the percentage, then find the chromatogram it came from. Check that a detection wavelength and gradient are stated, that the main peak is symmetrical rather than flat-topped, and that the baseline looks reasonable. Note the largest single impurity as well as the total, because a single 0.8 percent impurity and eight scattered 0.1 percent impurities are different situations that produce the same 99.2 percent.
Finally, look for what is missing. Peptide content, water content, and the analysis date are the three fields most often absent, and each one covers a failure mode neither purity nor identity addresses.
Receiving checklist, in order
| Step | Field to find | Fails if |
|---|---|---|
| 1. Link the paper to the vial | Lot number, compound name, amount | Any of the three do not match the container |
| 2. Confirm identity | Observed vs theoretical mass, tolerance | No tolerance stated, or difference outside it |
| 3. Recalculate independently | Full amino acid sequence | Sequence not printed on the document |
| 4. Read purity critically | Percentage plus the chromatogram | No chromatogram, or no stated wavelength |
| 5. Check the impurity profile | Largest single impurity | Only a total is reported |
| 6. Note the gaps | Peptide content, water content, date | Any of the three absent without explanation |
Running that sequence takes a few minutes per lot and produces a written record of what was checked, which is worth more than the individual conclusions when a question comes up months later.
Questions this comparison gets asked
Is a higher purity percentage always better?
Higher is generally better within a single method, but purity figures are only comparable when the methods behind them are comparable. A 99.5 percent produced on a short, steep gradient at 254 nm may represent a less well-characterized material than a 98.2 percent produced on a long, shallow gradient at 214 nm, because the second method resolved impurities the first one integrated into the main peak. Before comparing two certificates, check whether both state a detection wavelength and a gradient. If either omits them, the comparison is not meaningful and the difference between the two numbers should not drive a decision.
Can a lot be 99 percent pure and still be the wrong compound?
Yes, and this is the single most important reason the two figures are reported separately. Purity is an area ratio computed from a chromatogram, and the arithmetic never inspects the chemical composition of the main peak. A cleanly synthesized batch of the wrong sequence produces a beautiful chromatogram and a high purity figure. Only a mass measurement compared against the theoretical mass for the stated sequence distinguishes the correct compound from an incorrect one, which is why an identity confirmation should be read before the purity figure rather than after it.
What does peptide content mean and why is it lower than purity?
Peptide content, sometimes called net peptide, reports what fraction of the weighed powder is peptide rather than water, residual salts, and counterions left over from synthesis and lyophilization. It is routinely well below the HPLC purity figure, and that is expected rather than a problem, because the two measure different things. Purity describes the composition of the peptide fraction; peptide content describes how much of the total mass that fraction represents. A certificate reporting high purity and no peptide content is silent on how much compound is actually in the container.
Why do some certificates report two different theoretical masses?
Because monoisotopic and average masses are both legitimate references and they differ. Monoisotopic mass uses the most abundant isotope of each element and is the correct comparison for high-resolution instruments. Average mass is weighted across natural isotope abundance and suits lower-resolution work. For a peptide of a few thousand daltons the two typically differ by one to two units. A certificate that prints both, labeled, is being helpful. One that prints a single unlabeled figure leaves the reader unable to tell whether an apparent discrepancy is a real mismatch or a comparison against the wrong basis.
Does a certificate of analysis prove the material is safe?
No. A standard certificate covers purity, identity, and sometimes water content and peptide content. It does not address sterility, endotoxin, bioburden, residual solvents, or heavy metals unless those assays are explicitly listed, and on most research-grade documents they are not. Absence of an assay on the certificate is not evidence that the assay would pass; it is evidence that the assay was not reported. Materials supplied for laboratory research use are not evaluated for safety in humans or animals, and a certificate should be read as a chemistry document rather than a safety document.
Should the certificate be lot-specific or is a generic one acceptable?
Lot-specific. A generic certificate describes what a product is supposed to be rather than what a particular batch was measured to be, so it cannot support any claim about the vial in hand. The practical test is whether a lot number appears on the document and matches the container, and whether an analysis date is present and falls after the manufacturing date. A document missing either field, or carrying a lot number that does not match the vial, should be treated as unlinked to the material regardless of how strong the reported figures are.
Where to read next
- Reading an HPLC chromatogram: purity by area how the percentage is integrated, step by step
- Mass spectrometry for peptide identity confirmation monoisotopic versus average mass, charge states, tolerance
- How to review a peptide certificate of analysis the full field-by-field walkthrough
- Lot traceability: matching label, COA and records what to do when the paperwork does not link to the vial
- Spotting real versus fabricated COA documentation
- Third-party lab testing and COAs
All materials described here are supplied strictly for laboratory research use. They are not drugs, foods, cosmetics, or medical devices, and they are not for human or veterinary use, diagnostic use, or any form of consumption or administration. Nothing in this guide is a recommendation to acquire, prepare, or use any compound outside a controlled research setting. Analytical descriptions are general explanations of common laboratory methods and are not a substitute for a qualified analyst reviewing a specific certificate.