

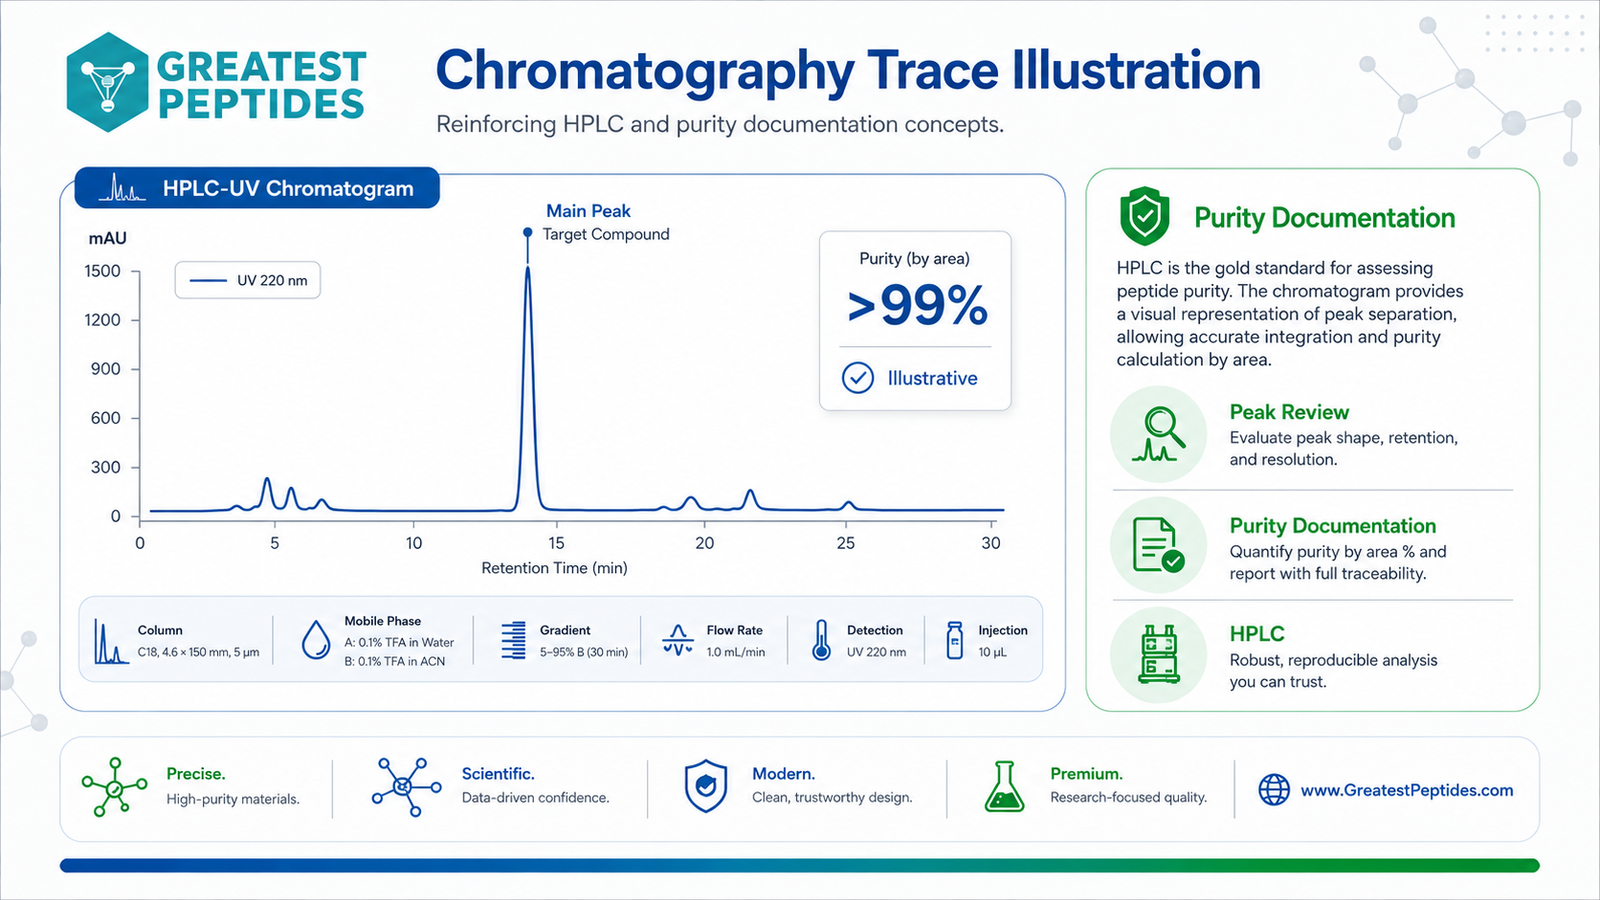
Reversed-phase HPLC is the standard method for assessing peptide purity. The chromatogram is a visual representation of detector response over retention time, and purity is calculated as the area percent of the main peak.
What the trace shows
The target compound appears as the main peak; earlier and later smaller peaks represent related impurities. Reviewers evaluate peak shape, retention time, resolution from neighboring peaks, and the overall impurity profile. Method parameters — column, mobile phase, gradient, flow rate, and detection wavelength — provide the context needed to interpret the trace.
Purity documentation
HPLC is widely used because it is robust and reproducible. Quantifying purity by area percent and reporting it with full traceability is central to a defensible COA.
Research use only. Products discussed are intended strictly for in-vitro laboratory research and are not for human or veterinary use.
The short version
A purity by area figure is a ratio computed inside one chromatogram, not a measurement of what fraction of the vial is peptide. The software integrates every peak the detector produced, divides the main peak area by the total, and reports the result. Everything outside that sum, anything that does not absorb at the chosen wavelength, anything that never left the column inside the run window, anything smaller than the integration threshold, is silently absent from the denominator. That makes the number sensitive to choices an analyst makes before the sample is ever loaded: wavelength, gradient slope, column chemistry, run length, and then to processing choices made afterward on data that is already fixed. The sections below work through each of those levers, the peak-shape vocabulary that tells you which one is in play, and how to read a supplied trace when the method behind it is not stated.
How the percentage is built and why it is only a ratio
Integration software does two things in sequence. It first decides where each peak begins and ends and where the baseline sits underneath it, then it computes the area enclosed between the curve and that baseline. The reported purity is one of those areas divided by the sum of all of them, multiplied by a hundred. The word to hold onto is sum: the denominator is built only from peaks the software chose to integrate in this particular run.
Three consequences follow, and all three tend to get lost when the figure is copied onto a certificate.
The first is that area percent assumes every component responds to the detector in proportion to how much of it is present, on the same scale. That is false in general. Ultraviolet absorbance depends on what is absorbing, so an impurity with weaker absorbance at the monitored wavelength contributes less area per unit mass than the main compound, and one with stronger absorbance contributes more. A related impurity that has lost a tryptophan residue does not simply produce a smaller peak, it produces a peak that understates its own abundance if the run is monitored where tryptophan dominates the signal. Area percent is an approximation to mass percent, not a synonym for it.
The second is that the figure is normalized. It always sums to a hundred across the peaks present. If a component never produces a peak, the remaining peaks do not shrink to make room for it; they simply divide the same hundred percent between themselves. Adding an invisible contaminant to a vial cannot lower an area-percent purity figure. It can only lower a mass-based measurement.
The third is that a purity percentage says nothing about how much target material was in the vial in the first place. Water retained after lyophilization, the counterion paired with basic residues, residual salts from cleavage and workup, and trapped solvent all contribute to the weight on the label without contributing any area. That is why a separate content or assay figure exists at all, and why the two numbers on a certificate are usually different, with content the lower of the two.
What the denominator contains, and what quietly sits outside it
| Sample component | Appears in the area sum? | Consequence |
|---|---|---|
| Target peptide | Yes, as the main peak | Supplies the numerator and part of the denominator |
| Related peptide impurities | Yes, if resolved and above threshold | Deletion, truncation, oxidation and dimer species that absorb much like the target |
| Counterion, commonly trifluoroacetate or acetate | No useful peak | Real dry mass with no area; pulls content down, leaves purity untouched |
| Residual water from lyophilization | No | Weighs, does not absorb, invisible to the ratio |
| Inorganic salts and small polar species | Usually not | Elute at or near the solvent front, where peaks are commonly excluded |
| Features below the area reject setting | No | Removed from the sum before the division, so the main peak looks larger |
| Species retained past the end of the run | No | Late hydrophobic material never elutes inside the window at all |
Read the ratio as a statement about the visible population. It answers one question: of everything this method could see, in this window, above this threshold, what share was the main peak. That is a genuinely useful question and reversed-phase separation answers it well. It is not the same question as what fraction of the powder is the named compound, and it is not usually the question a receiving lab thinks it is asking. Keeping the two apart is most of the difference between using a certificate and merely quoting one.
What the detection wavelength decides for you
Ultraviolet detection is selective whether or not anyone intends it to be. The detector reports absorbance at a wavelength the analyst picked, and every component in the sample is weighted by how strongly it happens to absorb there.
Near 214 nm the dominant absorbing feature is the peptide bond itself. Every amide linkage in the backbone contributes, so response scales roughly with chain length and is largely independent of which side chains are present. That is why 214 nm, or 215 and 220 nm as near equivalents, is the conventional choice for purity work. It is the closest thing to a universal peptide detector, and impurities that are themselves peptides show up whether or not they carry aromatic residues.
Near 280 nm the picture changes completely. Absorbance there comes from aromatic side chains, principally tryptophan and tyrosine, with a smaller contribution from phenylalanine and from disulfide bonds. A sequence containing neither tryptophan nor tyrosine barely absorbs at 280 nm at all. Running a purity trace at that wavelength on such a peptide produces either a nearly flat line or, worse, a chromatogram in which only the aromatic-containing impurities are visible while the main compound is faint. More often the failure runs the other way: the main peak is aromatic, several impurities are not, those impurities vanish, and the purity figure rises without any change in the material.
Both settings share a blind spot that no ultraviolet wavelength closes. A contaminant with no chromophore in the accessible range, an inorganic salt, a sugar, glycerol, a silicone leached from tubing or a stopper, produces no peak anywhere. It is not a small peak, it is nothing. The chromatogram is silent about it and the area percent is entirely unaffected by however much of it is present. Only a detector working on a different principle, evaporative, charged-aerosol, refractive index or mass spectrometric, will register it.
There is also a practical artifact of the far ultraviolet. Trifluoroacetic acid, the usual ion-pairing modifier, absorbs meaningfully below about 220 nm, and because the aqueous and organic mobile phases rarely match exactly in modifier content, a gradient run monitored at 214 nm often shows a rising or falling baseline. Where the software puts the baseline under that drift feeds directly into the area of every peak on the trace.
Detection settings and what each one can and cannot see
| Setting | What produces the signal | What it misses |
|---|---|---|
| 214 to 220 nm | The backbone amide bond, in every residue | Anything with no ultraviolet chromophore; also sits where the acid modifier absorbs |
| 254 nm | A legacy general-purpose setting, weak for most peptides | Most non-aromatic impurities and much of the main peak signal too |
| 280 nm | Tryptophan and tyrosine side chains | Any species lacking those residues, which may include the target itself |
| Diode array, full spectrum stored | Absorbance at every wavelength at every time point | Still blind to non-absorbing species, but allows peak-spectrum comparison |
| Evaporative or charged-aerosol detection | Anything less volatile than the mobile phase | Volatile impurities; response is not linear in the way ultraviolet response is |
| Mass spectrometry in line | Anything that ionizes under the source conditions | Poorly ionizing species, and isomers that share the target mass |
The useful habit is to check the stated wavelength before reading the percentage, and to ask whether it was the right one for this sequence. A trace at 280 nm on a peptide carrying a single tyrosine is not wrong, but it is a narrow view, and it will flatter the material relative to a 214 nm run on the same vial. Where a diode-array detector was used, a report can show the same separation at two wavelengths at once. When the two numbers differ noticeably, that difference is information rather than an error.
Conditions that move the figure without touching the material
The separation is the measurement. Change the separation and the number changes, even though nobody has touched the contents of the vial.
Gradient slope is the largest single lever. A shallow gradient, a small change in organic content per minute, spreads the elution window and pulls closely related species away from the main peak. Each one that resolves becomes its own integrated area and leaves the main peak smaller. A steep gradient compresses everything toward the same retention time, impurities that were separate merge into the main peak, and their area is counted as target. The steeper method reports the higher purity, reliably, on the same sample. This is the most common way an unremarkable lot acquires an impressive number.
Run length works the same way at the back end. Strongly retained species, aggregates, hydrophobic side products, fragments that never fully deprotected, elute late and sometimes very late. If the gradient ends and the run stops before a hold at high organic content, that material stays on the column, does not appear, and is not in the denominator. It also tends to reappear in the next chromatogram, which is one origin of ghost peaks. A method that ends with a wash step and a stated re-equilibration is a method that has at least looked for late material.
Column chemistry sets selectivity, not just retention. C18 is the default; C8 and C4 retain less and suit larger or more hydrophobic sequences; phenyl and biphenyl phases add aromatic interaction and often separate pairs that co-elute on straight alkyl chains. Two impurities that sit under the main peak on one phase can be baseline resolved on another. Nothing about the sample changed between the two runs.
Particle size, column length and temperature act on efficiency rather than selectivity, but the effect on the number is the same, since narrower peaks resolve more neighbors. Raising column temperature sharpens peaks and can also collapse or reveal the splitting caused by slow rotation around proline residues.
Loading matters as well. Overload the column and the main peak broadens and often fronts, burying small impurities inside its own footprint. Load too little and impurities sitting near the integration threshold fall below it and disappear from the sum.
How each method variable typically moves the reported percentage
| Variable | Change made | Usual direction of the number |
|---|---|---|
| Gradient slope | A steep fast ramp instead of a shallow one | Higher, because near neighbors merge into the main peak |
| Run length and wash | Stopping at the end of the ramp with no high-organic hold | Higher, because late hydrophobic material never elutes |
| Column chemistry | C18 swapped for phenyl, C8 or a different bonding | Either direction; selectivity decides which pairs separate |
| Particle size and bed length | Smaller particles, longer column, core-shell packing | Usually lower, as efficiency exposes shoulders as separate peaks |
| Column temperature | Raised from ambient to 40 to 60 degrees C | Either direction; sharpens peaks, can merge or split rotamer pairs |
| Mobile-phase modifier | Trifluoroacetic acid replaced by formic acid or a buffer | Often broader peaks and a different impurity profile at the same nominal purity |
| Amount on column | A larger load to make small impurities visible | Higher, as the broadened main peak absorbs its small neighbors |
None of this makes a fast method dishonest. Short runs have a real place in process control, and a supplier screening incoming lots at speed is doing something reasonable. What matters is that the method appears on the report. A purity figure with no column, no gradient table and no wavelength is an assertion rather than a measurement, because there is no way to judge whether the separation was capable of finding anything. When two certificates for the same compound disagree, comparing the two method sections usually explains the gap before anything else does.
Integration choices: one trace, several defensible answers
Everything above happens before the data exists. The next set of choices happens afterward, on data that is already fixed, and it can move the reported figure by a surprising amount.
Baseline placement is the foundation. Peak area is the region between the curve and a baseline the software constructs, so where that baseline is drawn determines how much area exists at all. On a drifting trace, common at 214 nm in a gradient run, a baseline drawn horizontally from the peak start gives a different area than one drawn along the drift. Analysts can and do reintegrate by hand, and manual reintegration is legitimate practice; it becomes a problem only when it is invisible in the report.
Then there is how partly resolved peaks are divided. The drop-line, or perpendicular drop, splits the pair with a vertical line at the valley between them, assigning everything to the left to one peak and everything to the right to the other. Tangent skimming instead treats the smaller peak as a rider sitting on the tail of the larger one, drawing a curved baseline underneath it, which assigns far less area to the small peak. On a shoulder or a tail rider the two conventions produce visibly different impurity percentages from identical raw data. Neither is wrong in principle, each suits a different physical situation, and a report that does not say which was used has left something out.
Exclusion windows are the next lever. Almost every method excludes the region at the very start of the run, where unretained material, salts and the sample solvent all arrive together as the solvent front, along with the small positive or negative disturbance that sample introduction itself produces on the detector. There is a good reason for that exclusion: nothing in the void volume has been separated, so nothing there can be quantified. But a window extending well past the void volume starts discarding real, if polar, impurities.
Finally there are thresholds. Integration parameters include a minimum area or height below which a feature is not treated as a peak at all. Setting that threshold loosely removes a scatter of small impurities from the denominator before the division happens. Reporting conventions often disregard peaks below a stated limit, which is sound practice when the limit is stated and misleading when it is not.
Processing choices and their effect on the same raw data
| Processing choice | What it does | Effect on the main-peak percentage |
|---|---|---|
| Baseline placement on a drifting trace | Sets the floor under every peak | Either direction; small peaks are affected proportionally more |
| Drop-line at the valley | Splits an unresolved pair with a vertical line | Lower than skimming, because the small peak keeps more of the shared area |
| Tangent skim of a rider peak | Treats a shoulder as sitting on the main peak tail | Higher, because the shoulder is assigned much less area |
| Solvent-front exclusion window | Discards everything before a chosen time | Higher, correctly so at the void volume, questionably so beyond it |
| Area or height reject threshold | Ignores features below a set size | Higher, by removing many small peaks from the sum entirely |
| Blank or gradient-blank subtraction | Removes features seen in a solvent-only run | Higher; correct when the feature is from the system, wrong if it is carryover |
| Manual reintegration | An analyst redraws peak start and end limits | Either direction; acceptable practice, but it should be disclosed |
The point is not that integration is arbitrary. It is that a single trace supports a range of defensible numbers, usually within a few tenths of a percent for a clean sample and considerably wider for a messy one. That range is why a printed percentage carries much less information than the picture it came from. Given the chromatogram itself, with axes and a peak table, a reviewer can see the baseline, see the valleys, and form an independent view. Given only the number, there is nothing to check.
Peak shape and artifacts, and what each usually indicates
Shape is diagnostic. Before reading any percentage it is worth spending a minute on what the peaks actually look like, because several shapes signal that the number attached to them is unreliable.
Tailing is the most common defect: the peak rises quickly and returns to baseline slowly, dragging a long asymmetric edge behind it. In peptide work the usual cause is secondary interaction between basic residues, lysine, arginine and histidine, and residual free silanols on the silica surface, which is exactly what the ion-pairing modifier is there to suppress. Aging columns, voids in the bed and excessive tubing volume produce the same signature. The practical harm is that a long tail conceals small later-eluting impurities inside it, and it forces the integrator to choose between a drop-line and a skim.
Fronting is the mirror image and usually means overload: more material than the stationary phase can hold in the linear range, so the leading edge runs ahead of the band. It also appears when the sample was dissolved in a solvent stronger than the starting mobile phase, so the band travels some distance through the head of the column before it focuses.
A shoulder is a partly resolved peak, and treating it as noise is the most consequential mistake in this whole exercise. Shoulders on peptide main peaks are commonly a deamidation product, an oxidized methionine, a diastereomer from racemization during coupling, or a sequence missing a single residue. All of those elute close to the parent because chemically they differ from it very little. A method with more resolving power will pull them apart; a faster method merges them entirely.
A split peak, one that dips toward baseline and rises again, is usually mechanical: a void or channel at the column inlet, a partly blocked frit, or a sample solvent that is too strong. It can also be genuine, when cis and trans proline rotamers interconvert slowly enough on the timescale of the separation to travel as two bands.
Ghost peaks appear where no sample was loaded and belong to the system rather than to the material: contaminated mobile phase, leached plasticizer, or material accumulated on the column from earlier runs and released by the gradient. Carryover is the related case, where a peak from the previous sample turns up in the following chromatogram because the wash was inadequate.
Shape features and the usual reading
| Feature | Usual cause | Effect on interpretation |
|---|---|---|
| Tailing main peak | Silanol interaction with basic residues, aging column, extra tubing volume | Hides small late impurities in the tail; integration becomes a judgment call |
| Fronting main peak | Column overload, or sample solvent stronger than the starting eluent | The broadened peak covers its neighbors and purity reads high |
| Shoulder on the main peak | Deamidation, oxidation, a diastereomer or a deletion sequence | A real impurity that a faster method would simply count as target |
| Split main peak | Void or blocked frit at the column head, strong sample solvent, proline rotamers | Either an instrument fault or two genuine conformers; the run should be repeated |
| Ghost peaks in a blank run | Mobile-phase contamination, leachables, material released from the column | Not sample impurities, but they must be identified before they are subtracted |
| Carryover from the previous sample | Inadequate needle or column wash between runs | Adds area that belongs to a different vial |
| Rising or falling baseline | Modifier absorbance mismatch between the two mobile phases at low wavelength | Shifts every peak area through the baseline the software draws |
A trace with sharp, symmetrical, well-separated peaks is evidence that the method was working, and that is a precondition for the number meaning anything. A trace showing a broad tailing main peak with a figure of ninety nine and change attached is a document that has reported a result the separation was not in a position to support. In that situation the honest conclusion is not that the material is bad. It is that the chromatogram has not established anything yet and the run should be repeated on a column in better condition.
A single peak is not proof of a single compound
Co-elution is the limit case of everything above. Two species that share a retention time under one set of conditions produce one peak, and one peak integrates as one component. The chromatogram cannot distinguish a pure band from a perfectly overlapped pair, because absorbance plotted against time contains no information about composition.
Some overlaps are far more likely than others. Species differing from the target by a small, hydrophobically neutral change tend to sit almost exactly on top of it: a deamidated residue, an epimerized center where one amino acid has racemized, an isoaspartate rearrangement, sometimes a conservative substitution introduced by impure starting material. Several of those also share the target mass, so even a mass measurement on the collected peak will not separate them.
There are three ways to look underneath a peak. A diode-array detector allows a peak purity assessment: spectra are collected across the peak and compared, and a change in composition on the upslope, apex and downslope shows up as a spectral mismatch. This only works when the two components genuinely have different ultraviolet spectra, which for two closely related peptide sequences is often not the case. Mass spectrometry coupled to the separation is stronger, because it reports mass continuously across the peak and will show a second component of different mass immediately. It remains blind to isomers.
The third approach is orthogonal separation: run the same sample on a mechanism that separates by something other than hydrophobicity. Ion-exchange separates by charge and readily resolves deamidation products that reversed-phase merges. A substantially different mobile-phase pH changes the ionization state of side chains and shifts selectivity as well. For stereochemistry the honest answer is that neither separation by hydrophobicity nor a mass measurement closes the gap; it takes hydrolysis followed by chiral analysis of the released amino acids.
That is the real shape of the limitation. A chromatogram establishes that the material is dominated by one species under one separation mechanism. It never establishes what that species is, and on its own it never establishes that the species is single. Identity confirmation, and where it matters an orthogonal separation, are what turn a high area percent into a claim that can be defended.
Reading a supplied chromatogram: what to check before accepting the number
| What to look for | A report you can work with | A report you cannot |
|---|---|---|
| Axes | Both axes labeled with units, time in minutes, response in absorbance units | Unlabeled axes, or an image with the axes cropped away |
| Run window | The full run shown, from the solvent front through the high-organic wash | A view zoomed to a few minutes around the main peak only |
| Vertical scale | Scale stated, or an inset at higher gain showing the baseline region | One tall main peak with the baseline flattened by the chosen scale |
| Peak table | Retention time, area and area percent listed for every integrated peak | A single percentage printed underneath the picture |
| Method statement | Column and dimensions, mobile phases, gradient, flow, temperature, wavelength | No method at all, or a partial one with the gradient omitted |
| Traceability | Lot number, sample identifier, acquisition date, instrument and analyst | A generic image reused across lots with no lot number on it |
| Integration disclosure | Threshold and any exclusion window stated, baseline visible under the peaks | Integration marks removed, or the trace redrawn as a clean graphic |
Two quiet checks are worth running on any peak table. First, add the area percentages up. They should come to a hundred, and if they do not, something has been excluded that the report did not mention. Second, compare the main peak retention time against the total run length. A main peak eluting in the last tenth of the run leaves no room to see anything more hydrophobic, and a main peak arriving in the first minute may be sitting in the void volume, where nothing has been separated from anything. Neither is fatal, but both change what the percentage can support.
Questions this guide gets asked
Why do two labs report different purity for the same lot?
Almost always because they ran different methods, not because one of them is wrong. Gradient slope, run length, column chemistry, temperature, amount on column and detection wavelength each shift the figure, and integration settings shift it again afterward. A steep short run on a less efficient column reports a higher number than a shallow run on a modern column, using the same vial. Before treating a discrepancy as a dispute, put the two method sections side by side. If the numbers still differ once the separations look comparable, the question becomes whether the material itself changed between the two samplings, which storage and shipping history can sometimes explain.
Which detection wavelength should a purity chromatogram use?
For general peptide purity work, somewhere in the 210 to 220 nm range, because the signal there comes from the backbone amide bond and every peptide species responds regardless of its side chains. A 280 nm trace is useful as a confirmatory second channel when the sequence contains tryptophan or tyrosine, and it is close to meaningless when it does not. If a certificate reports purity from a 280 nm run for a sequence with no aromatic residues, that is worth querying directly. A diode-array acquisition that stores the whole spectrum lets a reviewer look at both views without rerunning the sample at all.
Is a symmetrical single peak proof of a single compound?
No. It is proof that under that one separation mechanism nothing else eluted at a resolvably different time. Species differing from the target by deamidation, by the position of an oxidation, or by a racemized center often co-elute almost exactly, and some of them also match the target mass, so mass detection alone does not always separate them either. Confidence comes from stacking mechanisms: a diode-array peak purity check, a mass measurement taken across the peak rather than at the apex only, and where it matters a second separation on a different mechanism such as ion exchange or a substantially different mobile-phase pH.
Why are peaks near the solvent front usually excluded?
Because nothing there has been separated. Unretained material passes through the column in the void volume, and everything that does not interact with the stationary phase, salts, the sample solvent itself, small polar species, arrives together at that same time. A peak in that region is a mixture by definition, so integrating it as though it were a component would be misleading. The legitimate exclusion window is the void volume and a little either side of it. A window extending well past that starts discarding polar impurities that were in fact separating, and a good report states where the window ends.
What does a shoulder on the main peak usually mean?
It means a second species is present and the method is only just failing to resolve it. Common candidates in peptide work are a deamidation product, an oxidized methionine, a diastereomer produced by racemization during coupling, and a sequence missing one residue. All of these are chemically close to the target and therefore elute close to it. Whether the shoulder is counted as an impurity depends on integration, since a drop-line assigns it real area while a tangent skim assigns it much less. The informative response is to rerun with a shallower gradient or a different stationary phase and see whether it separates.
What should be asked for when only a cropped image is supplied?
Ask for the full acquisition report rather than a picture: the whole run from the solvent front to the end of the wash, both axes labeled, the peak table with retention time and area for every integrated peak, and the method section with column, gradient, flow, temperature and wavelength. Ask whether the lot number on the trace matches the vial in hand. If what comes back is the same image again, that is itself informative. An image with no axes, no peak table and no method cannot be checked by anyone, and the percentage on it should be treated as a claim rather than as data.
Where to read next
- Peptide purity versus peptide identity for research labs why an area percentage and a mass match answer different questions
- Mass spectrometry for peptide identity confirmation the orthogonal check that a chromatogram cannot supply
- How to review a peptide certificate of analysis the full field-by-field walkthrough of the document
- Spotting real versus fabricated COA documentation what a reused or redrawn trace looks like
- Third-party lab testing and certificates
All materials referenced here are supplied strictly for laboratory research use. They are not drugs, foods, cosmetics or medical devices, and they are not for human or veterinary use, diagnostic use, or any form of consumption. Nothing in this guide is guidance for use outside a controlled research setting. The analytical descriptions are general explanations of common chromatographic practice and do not replace a qualified analyst reviewing a specific certificate and the data behind it.