

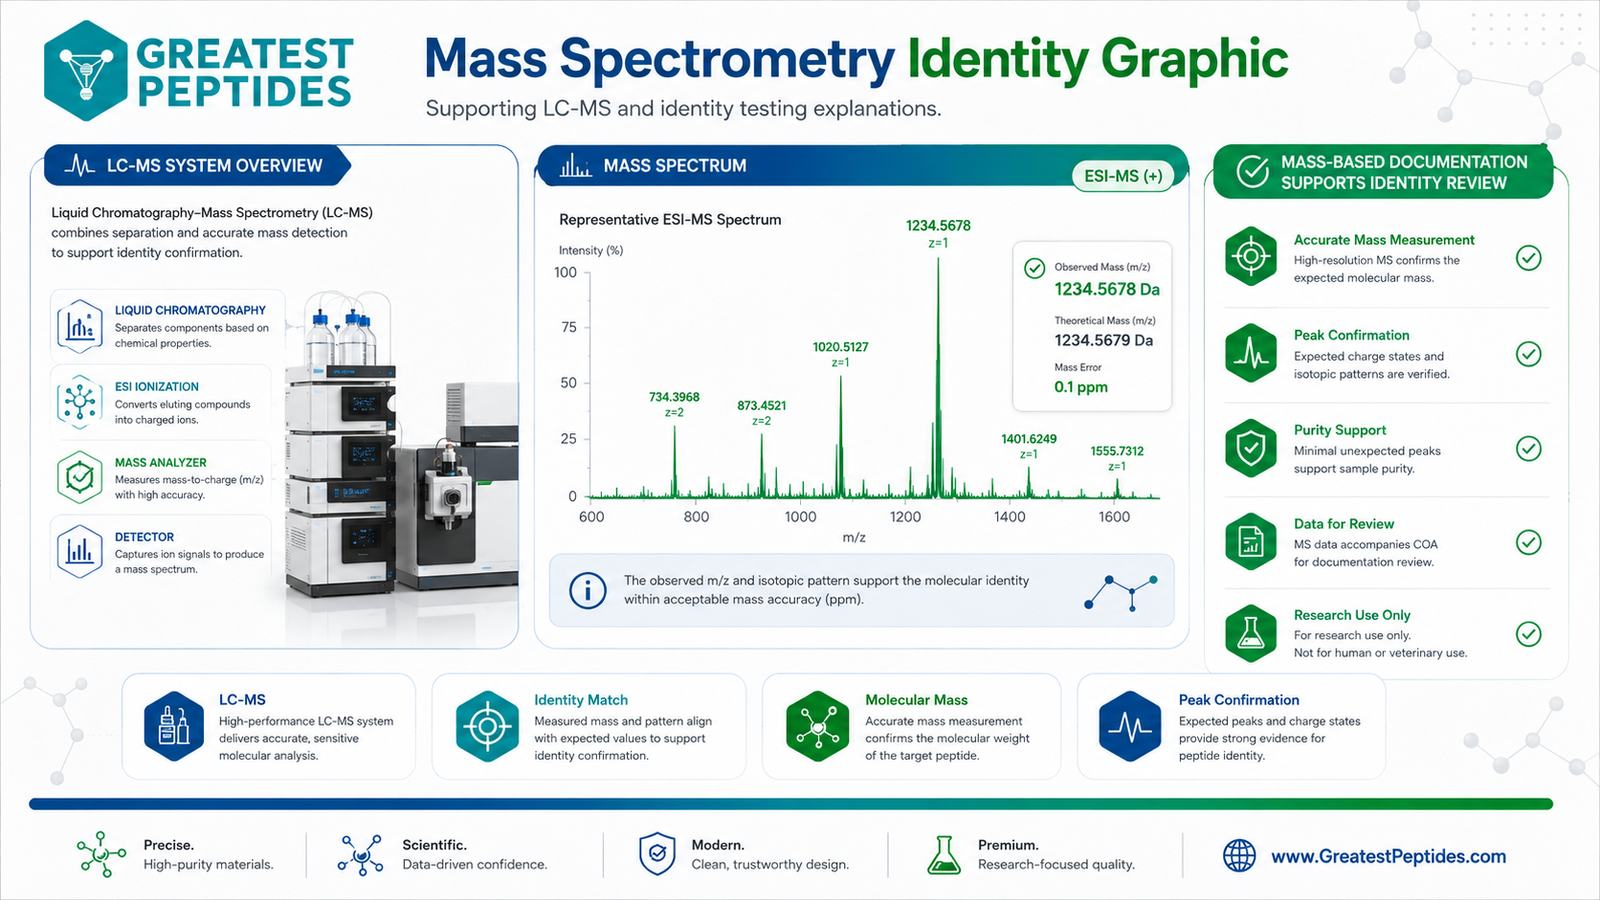
Liquid chromatography coupled with mass spectrometry (LC-MS) provides an orthogonal, mass-based confirmation of peptide identity. Where HPLC answers “how pure is it,” mass spectrometry answers “is it the right molecule.”
How LC-MS confirms identity
The sample is separated by liquid chromatography, ionized (commonly by electrospray ionization, ESI+), and measured by a mass analyzer that reports mass-to-charge (m/z) with high accuracy. The observed mass is compared to the theoretical mass of the target peptide within a tight parts-per-million (ppm) error, and isotopic patterns and expected charge states support the assignment.
What reviewers look for
Accurate mass measurement, peak confirmation (isotopes and adducts consistent with the expected species), minimal unexpected peaks supporting purity, and the inclusion of the spectrum in the certificate of analysis for documentation review.
Research use only. Products discussed are intended strictly for in-vitro laboratory research and are not for human or veterinary use.
The short version
Almost every argument about a mass spectrum comes down to arithmetic the report itself does not show. A peptide has two theoretical masses, not one, and comparing an observed value against the wrong one produces an apparent mismatch of a unit or two in a lot that is perfectly correct. Electrospray returns a ladder of multiply charged ions rather than one number, and converting that ladder back to a neutral mass is a two-term calculation any reader can run. Adducts, oxidation and cyclization move an observed mass by amounts that are tabulated and predictable. And a whole class of real differences, starting with leucine against isoleucine, cannot be seen by mass at any resolution. What follows is the working detail: the constants, a worked deconvolution, the tolerance defensible on a given instrument, and the point at which an intact mass stops being evidence.
Two theoretical masses, and which one the report means
Any given sequence has a monoisotopic mass and an average mass, and they are not interchangeable. The monoisotopic value sums the lightest and most abundant isotope of each element: carbon-12 at exactly 12, hydrogen-1 at 1.00783, nitrogen-14, oxygen-16, sulfur-32. The average value sums the standard atomic weights, which are abundance-weighted across the natural isotope mixture, so carbon enters as 12.011 rather than 12.
The gap between them scales with how many atoms are in the molecule, and for peptides it runs at roughly 0.06 percent of the mass. That is a little over half a unit at 1,000 Da, about 1.2 Da at 2,000 Da, and roughly 2.5 Da at 4,000 Da. A report that lists an observed value of, say, 4,180.5 against a theoretical value of 4,183.0 has not necessarily found a problem. It may have compared a monoisotopic measurement against an average calculation, and the 2.5 Da discrepancy is the whole of the finding.
Which one is correct depends entirely on whether the instrument resolved the isotope cluster. A peptide does not produce one peak. It produces a cluster, because some fraction of its carbon atoms are carbon-13, and each substitution adds 1.00335 Da. If the analyzer separates those into distinct peaks, the first peak in the cluster is the all-light species, and the monoisotopic value is the right reference. If the analyzer smears the cluster into a single unresolved hump, the centroid of that hump approximates the average value, and the average is the right reference. There is no third option and no averaging between them.
For research peptides, which mostly sit under 5,000 Da, a modern high-resolution instrument resolves the cluster easily and monoisotopic is nearly always the correct basis. Linear-mode MALDI and older single-quadrupole work at unit resolution do not, and the average value applies. Sequences carrying sulfur widen the cluster further, since sulfur-34 sits about two units above sulfur-32 at a natural abundance near four percent. The practical requirement is simply that the report says which basis it printed. An unlabeled theoretical mass leaves the reader unable to tell a real failure from a units mismatch, and that ambiguity is avoidable at the point the document is written.
The two mass bases and when each is the right comparison
| Monoisotopic | Average | |
|---|---|---|
| How it is calculated | Lightest and most abundant isotope of each element | Standard atomic weights, weighted across natural abundance |
| Which peak it names | The first peak of the isotope cluster | The centroid of the whole unresolved cluster |
| Correct when | The instrument resolves individual isotope peaks | The cluster arrives as one unresolved envelope |
| Typical instruments | Orbitrap, FT-ICR, QTOF, reflectron MALDI | Linear MALDI, single quadrupole at unit resolution |
| Relationship | The lower of the two values | Higher by roughly 0.06 percent of the mass |
| Failure it causes | Compared to a low-resolution centroid, looks 1 to 3 Da light | Compared to a resolved first peak, looks 1 to 3 Da heavy |
One trap follows directly from this. Above roughly 1,800 Da the second peak in the isotope cluster, the one carrying a single carbon-13, becomes as tall as the first, and above about 2,500 Da it is usually taller. The most intense peak in a resolved cluster is therefore often not the monoisotopic peak. Reading the mass off the tallest signal, which is what an untrained eye does, introduces an error of one or two whole units in the exact mass range where research peptides sit.
Working a charge-state ladder back to a neutral mass
Electrospray does not measure mass. It measures mass-to-charge, and it puts several protons onto a peptide that has more than one basic site, so a single compound arrives as a series of peaks at different charge states. That is why a report often shows five values rather than one. Each of those peaks is a separate, independent estimate of the same neutral mass, and the conversion is arithmetic anyone can check on paper.
The relationship is that an observed m/z equals the neutral mass plus z protons, all divided by z. Rearranged, the neutral monoisotopic mass equals z multiplied by the observed m/z, minus z multiplied by 1.00728. That constant is the mass of a proton, the hydrogen atom at 1.00783 less the electron at 0.00055. Reports using 1.008 instead are sloppy by about 0.0005 Da per charge, invisible at unit resolution and not invisible at 2 ppm on a five-charge ion.
The remaining question is how to know z when the report does not state it. Two methods work. If the isotope cluster is resolved, adjacent isotope peaks are separated by 1.00335 divided by z, so a spacing near 0.5 means doubly charged, 0.33 means triply charged and 0.25 means quadruply charged. If the isotopes are not resolved but two adjacent charge states are visible, the charge on the higher-m/z peak equals the lower m/z minus 1.00728, divided by the gap between the two m/z values.
Which charge states appear at all is a property of the sequence rather than a setting on the instrument. Protons sit preferentially on arginine, lysine, histidine and the free N-terminus, so a sequence rich in basic residues spreads across a wide envelope while one with a single basic site may show only the singly and doubly charged forms. An envelope that looks unexpectedly narrow or wide for the stated sequence is itself a small piece of evidence.
The worked example below is a hypothetical peptide, not any particular product. Five charge states were picked off the raw spectrum and each converted independently. They do not land on identical values, and that scatter is the useful part: the spread across the ladder is a direct read on how well the instrument was calibrated that day, in a way that a single deconvoluted number printed by software conceals entirely.
Deconvoluting a five-peak electrospray ladder by hand
| Observed m/z | Charge | Neutral mass = z x (m/z) - z x 1.00728 |
|---|---|---|
| 2091.2600 | 2+ | 4182.5200 - 2.0146 = 4180.505 |
| 1394.5060 | 3+ | 4183.5180 - 3.0218 = 4180.496 |
| 1046.1310 | 4+ | 4184.5240 - 4.0291 = 4180.495 |
| 837.1090 | 5+ | 4185.5450 - 5.0364 = 4180.509 |
| 697.7560 | 6+ | 4186.5360 - 6.0437 = 4180.492 |
The five estimates average to 4180.499 and span 0.017 Da, about 4 ppm across the ladder, which is a respectable result for an externally calibrated instrument. The charge assignment can be checked without trusting the labels: take the 1046.1310 and 1394.5060 peaks, subtract 1.00728 from the lower one to get 1045.124, and divide by the 348.375 gap between them. The answer is 3.000, which is the charge on the higher peak, confirming that the pair are the 4+ and 3+ states of one species rather than two unrelated ions.
Adducts, losses and modifications that move the observed value
A mismatch of a few units is far more often an adduct or a known chemical modification than a wrong sequence, and most of the candidates carry fixed, tabulated mass shifts. Subtracting those candidates before declaring a failure is the single most useful habit in reading these reports.
Adducts are gas-phase and solution artifacts. Sodium and potassium leach out of glassware, buffer salts and some plastics, and each one displaces a proton on the ion rather than binding to the molecule covalently. Ammonium comes from ammonium acetate or formate in the mobile phase. Trifluoroacetate rides along from reversed-phase purification and lyophilization and shows up as an associated species roughly 114 units heavy. None of these mean the material is the wrong compound. They mean the sample carried salt, and they usually vanish when the sample is desalted or the mobile phase is changed. The diagnostic is that an adduct appears alongside the ordinary protonated series at the same retention time, with the same peak shape.
Covalent modifications are a different matter, because they are a real change to the material. Oxidation at methionine adds one oxygen at 15.995 and happens on exposure to air, light or peroxide-contaminated solvent. Cyclization of an N-terminal glutamine to pyroglutamate loses ammonia and drops the mass by 17.027; the same reaction on an N-terminal glutamate loses water instead and drops it by 18.011. Disulfide bond formation costs two hydrogens, 2.016 per bond, so a two-bond peptide measured in its closed form sits 4.031 below the same sequence measured with the bonds reduced. In-source dehydration removes water at 18.011 and is an instrument artifact rather than a property of the material, which is why it appears at some source settings and not others.
The way to tell the two categories apart is chromatography. A covalent modification is a different molecule, so it generally elutes at a different time and carries its own full charge ladder. An adduct is the same molecule wearing a cation, so it co-elutes with the parent and its abundance tracks the salt content of the sample rather than the history of the lot.
Common mass shifts, with monoisotopic values
| Species or change | Shift (Da) | Origin and what it implies |
|---|---|---|
| Sodium adduct, against the protonated ion | +21.982 | Sodium from glass, buffers or plastic displaces a proton. An artifact, not a change to the material. |
| Potassium adduct, against the protonated ion | +37.956 | Same mechanism, usually from buffer salts or residue on labware. |
| Ammonium adduct, against the protonated ion | +17.027 | Ammonium acetate or formate in the mobile phase. Goes away when the buffer changes. |
| Trifluoroacetate association | +113.993 | Residual TFA from reversed-phase work. Speaks to salt form, not to sequence. |
| Methionine oxidation | +15.995 | Air, light or peroxide in solvent. A real covalent change, and it usually elutes earlier. |
| Pyroglutamate from N-terminal Gln | -17.027 | Cyclization on storage in solution. From an N-terminal Glu the same reaction loses water, -18.011. |
| Disulfide bond formation | -2.016 | Two thiols oxidize to one bond, losing two hydrogens. Per bond, so two bonds cost 4.031. |
Read in the other direction, this table is a checklist for an unexplained gap. A value 22 units high is sodium before it is anything else. A value 16 units high on a methionine-containing sequence is oxidation. A value 2 units low on a cysteine-containing sequence is a closed disulfide compared against a theoretical mass calculated for the open form. Only once those have been ruled out, in that order, does a gap become evidence about identity rather than evidence about how the sample was handled.
Stating accuracy in ppm rather than in daltons
Absolute error scales with the mass being measured, which makes daltons a poor unit for describing how good an instrument is. Parts per million normalizes it: the ppm error is the difference between observed and theoretical, divided by the theoretical value, multiplied by one million. A 0.02 Da error on a 4,180 Da peptide is 4.8 ppm and is a good measurement. The identical 0.02 Da error on a 500 Da fragment is 40 ppm and is a poor one. Nothing about the instrument changed between those two statements.
Running it the other way is just as useful when a report quotes a tolerance in ppm and the reader wants to know what it excludes. Five ppm at 4,180 Da is 0.021 Da. Ten ppm at 2,000 Da is 0.02 Da. One hundred ppm at 2,000 Da is 0.2 Da. That last figure is worth sitting with, because plenty of routine work is done at accuracy in that region and a 0.2 Da window sounds tight until it is written out in units next to the modifications listed in the previous section.
There is a common presentation error here. The ppm figure should be computed on the neutral deconvoluted mass against the neutral theoretical mass, or on a raw m/z against the theoretical m/z for the same charge state. Mixing the two, which happens when a report deconvolutes the observation but quotes the tolerance against a singly charged calculation, changes the denominator and can shift the apparent ppm error by a factor equal to the charge. A report that shows both the raw m/z and the deconvoluted mass makes this checkable in a few seconds; one that shows only a summary line does not.
The other thing to watch is a tolerance quoted as a percentage. Plus or minus 0.1 percent reads as a tight specification but is 1,000 ppm, which at 2,000 Da is 2 Da. A window that wide admits a deamidation product, a disulfide state change and most single-residue substitutions. It is not wrong to run a low-resolution instrument, but a tolerance has to be stated in a form that makes plain what it excludes.
Realistic mass accuracy by instrument class
| Instrument class | Realistic accuracy | What that is in Da at 2,000 Da |
|---|---|---|
| FT-ICR or Orbitrap, internal calibration | 1 to 3 ppm | 0.002 to 0.006 Da |
| Orbitrap or QTOF, external calibration | 5 to 15 ppm | 0.01 to 0.03 Da |
| Reflectron-mode MALDI-TOF | 10 to 50 ppm | 0.02 to 0.10 Da |
| Linear-mode MALDI-TOF | 100 to 500 ppm | 0.2 to 1.0 Da |
| Single quadrupole or ion trap, unit resolution | about 0.2 to 0.5 Da absolute | roughly 100 to 250 ppm |
| A stated tolerance of plus or minus 0.1 percent | 1,000 ppm | 2 Da, wide enough to admit real modifications |
The question a tolerance has to answer is not whether it sounds tight but whether it is narrower than the nearest species that could plausibly be in the vial. A window of plus or minus 1 Da on a sequence containing asparagine cannot distinguish the intended compound from its deamidated form, so on that sequence the check is not testing what it appears to test. A well-written report states the window and, ideally, says what the window rules out.
Differences that no intact mass measurement can see
Some of the ways a peptide can be wrong are invisible to a mass measurement in principle, not merely on a cheap instrument, and it is worth being precise about which ones.
Leucine and isoleucine have the same elemental composition. Their residue masses are identical to every decimal place, at every resolution, forever. A swap between them is undetectable by mass, and it is not a hypothetical error, since they are the pair most often transposed in a sequence transcription. Telling them apart requires either fragmentation chemistry that cleaves the side chain, such as high-energy collision or ultraviolet photodissociation, or a chromatographic comparison against an independently verified reference standard.
Composition ambiguity is the second class. Two glycine residues sum to 114.04293, and one asparagine residue is 114.04293. Alanine plus glycine sums to 128.05857, and glutamine is 128.05858. An intact mass simply cannot say which composition is present, and any reordering of a fixed set of residues is exactly isobaric with the intended sequence.
Then there are the differences that exist but are too small for a low-resolution instrument. Lysine and glutamine differ by 0.036 Da, which is about 18 ppm at 2,000 Da, so distinguishing them takes both the resolution to separate the isotope clusters and calibration good enough for a sub-10 ppm assignment. Oxidized methionine and phenylalanine differ by 0.033 Da, roughly 16 ppm, with the same requirement.
The one-unit differences deserve special care because they look easy and are not. Asparagine against aspartate, and glutamine against glutamate, differ by 0.984 Da. On a resolved spectrum that is distinguishable. On a centroid it is not, because the carbon-13 peak of the lighter species sits 1.00335 above its first peak, which is only 0.019 Da away from the first peak of the heavier species. The two overlap. Deamidation, which converts asparagine to aspartate spontaneously in solution over time, produces exactly this shift, so an intact mass check run with a one-unit tolerance is structurally incapable of detecting one of the most common storage-related degradation routes. It is worth being clear that this is a limitation of the comparison rather than of the instrumentation, and it disappears the moment the isotope pattern is shown.
Residue-level differences and what it takes to resolve them
| Difference | Mass gap (Da) | What is required |
|---|---|---|
| Leu against Ile | 0.000, identical formula | Not a mass problem at any resolution. Needs side-chain fragmentation or a verified reference standard. |
| Gly + Gly against Asn | 0.000 | Composition is ambiguous at the intact level. Needs fragment ions that place the residues. |
| Ala + Gly against Gln | 0.000 | Same ambiguity, and it appears in more sequences than most readers expect. |
| Lys against Gln | 0.036 | About 18 ppm at 2,000 Da. Resolved isotopes plus a tolerance well under 10 ppm. |
| Oxidized Met against Phe | 0.033 | About 16 ppm at 2,000 Da. Same requirement, though the two behave differently on a column. |
| Asn against Asp, Gln against Glu | 0.984 | Lands 0.019 Da from the carbon-13 peak of the lighter species. Needs resolved isotopes, not a centroid. |
| Deamidation product | +0.984 | Same overlap. A plus or minus 1 Da window cannot exclude it, so the check does not cover this route. |
The conclusion is narrower than it first appears. An intact mass match is a necessary condition for correct identity and a strong filter against gross errors such as a wrong compound, a missing residue or a wrong salt form. It is not a sufficient condition, and the size of the gap between necessary and sufficient is set entirely by the tolerance that was applied. A report that states its tolerance is, whether or not it means to, telling the reader exactly how large that gap is on this particular sequence.
Where fragmentation and source choice change the answer
Establishing residue order requires breaking the molecule apart and measuring the pieces. In tandem mass spectrometry the instrument selects one precursor ion, fragments it, and measures the products. Collision-based fragmentation cleaves the amide backbone and produces b ions counting from the N-terminus and y ions counting from the C-terminus. The difference in mass between two consecutive y ions is the residue that sits between them, so a complete y series reads the sequence off the spectrum one residue at a time. Electron-transfer methods cleave a different bond, give c and z ions, and are preferred when a labile modification would be knocked off by collision.
Coverage is the figure that matters and the one most often left out. A report showing six assigned fragments on a twenty-residue peptide has read a fraction of the sequence, and any substitution inside an uncovered stretch is invisible. Proline disrupts the expected fragmentation pattern, and stretches with no basic residue to hold a charge fragment poorly, so gaps are common even in careful work. Reading a fragmentation report means looking at which residues are bracketed by assigned ions, not at how many ions were assigned in total. A disulfide-bonded or cyclic peptide is a particular case, since fragments inside a closed loop stay tethered together and the spectrum stays uninformative until the bonds are reduced.
Source choice changes what the report looks like before any of this. Electrospray introduces the sample from liquid, which makes it natural to couple to chromatography, so an LC-MS result carries a retention time as well as a mass and produces the multiply charged ladder discussed above with its repeated independent estimates. MALDI ionizes from a crystallized matrix, produces mainly singly charged ions so each species gives one peak, tolerates salts and buffers far better, and runs fast with little sample preparation. Its weaknesses are poorer mass accuracy in linear mode, matrix clutter below roughly 700 Da, and the fact that without an upstream separation a co-eluting impurity is not separated from the target at all. Neither source is inherently more trustworthy; they simply put the burden of proof in different places, and a report should say which one produced the numbers it prints.
What each measurement settles and what it leaves open
| Measurement | What it establishes | What it leaves open |
|---|---|---|
| Electrospray intact mass, deconvoluted | A neutral mass consistent with the stated formula, plus a retention time when run by LC-MS | Residue order, isomers, and where a modification sits |
| Resolved isotope envelope | The charge state and a check on elemental composition | Everything above, plus any co-eluting isobaric species |
| MALDI-TOF intact mass | A fast, salt-tolerant, mostly singly charged mass | Fine structure in linear mode, and labile modifications that survive poorly |
| Tandem MS with b and y ions | Residue order across the stretches that actually fragmented | Leu against Ile, and any stretch with no fragment coverage |
| Tandem MS after reduction | Order inside a peptide that was disulfide bonded | Which cysteines were paired before the bonds were opened |
| Comparison against a reference standard | That the material behaves identically to a known sequence | Nothing at all, if the standard was itself never verified |
Fragmentation data rarely appears on a routine research-grade document, and its absence is not by itself a red flag. What is worth asking is which of the two claims a given report is making. A report that says the observed mass is consistent with the stated sequence is making an honest and limited claim. A report that says the sequence itself was confirmed, with no fragmentation data anywhere in it, is claiming rather more than the measurement it describes can actually support.
Questions this guide gets asked
The observed value sits about 22 units above theoretical. Is the lot wrong?
Almost certainly not. A shift of 21.982 is the signature of a sodium adduct, where a sodium cation has displaced a proton on the ion. It comes from glass, buffer salts or labware residue rather than from the molecule, and the same sample desalted usually shows the ordinary protonated series with the sodiated peak much reduced. The confirming detail is that the sodiated species co-elutes with the parent, at the same retention time and peak shape, because it is the same molecule carrying a different cation. A potassium adduct behaves the same way at 37.956. Neither is evidence about sequence, though a persistently strong adduct series does say something about salt content.
The observed value is one unit high. What are the candidates?
Three explanations account for most cases. The first is a comparison against the wrong mass basis, since monoisotopic and average values for a peptide of a few thousand daltons differ by roughly one to two units. The second is deamidation, which converts asparagine to aspartate or glutamine to glutamate and adds 0.984 Da; it happens spontaneously in solution and is a storage question rather than a synthesis question. The third is taking the mass off the carbon-13 peak, which above roughly 2,500 Da is often the tallest in the cluster. Separating the three needs the raw spectrum rather than the summary number.
Does a matching intact mass confirm the amino acid sequence?
No, and the distinction is not pedantic. An intact mass confirms that the elemental composition of the material is consistent with the stated sequence. Any reordering of the same residues has the same composition and therefore the same mass, and several residue combinations sum to the same value as a single different residue, so composition itself is not uniquely determined. Leucine and isoleucine are identical by mass at any resolution. Reading order requires fragmentation, where the mass differences between consecutive fragments spell out the residues. An intact mass is a strong filter against gross error and a weak one against substitution.
Is MALDI or electrospray the better source for a routine identity check?
They trade different weaknesses. Electrospray runs from liquid, so it couples naturally to chromatography and a result carries a retention time alongside a mass, and its multiply charged ladder gives several independent estimates of the same neutral mass. MALDI produces mainly singly charged ions, so each species gives one peak, and it tolerates salts and buffers that would suppress an electrospray signal. Its costs are lower mass accuracy in linear mode, matrix background at low mass, and no upstream separation unless one is added. For a peptide of a few thousand daltons, liquid chromatography coupled to electrospray on a high-resolution analyzer is the more informative of the two.
What tolerance should be accepted when the report does not state one?
Rather than assuming a number, work backward from the instrument. If the report names a high-resolution analyzer and shows resolved isotope peaks, a few ppm is reasonable and anything beyond about fifteen ppm deserves a question. If it shows an unresolved envelope from a unit-resolution instrument, accuracy of a few tenths of a dalton is realistic and the comparison should be against an average mass. The more important test is whether the window is narrower than the nearest species that could plausibly be present. On a sequence containing asparagine, a one-unit window cannot exclude a deamidated form.
A report gives one deconvoluted number and nothing else. What is missing?
Four things, each checkable when present and unrecoverable when absent. The mass basis, without which a discrepancy of a unit or two cannot be interpreted. The raw charge states, which let a reader redo the deconvolution and see how well the estimates agree rather than trusting one software output. The tolerance actually applied, which is what turns a comparison into a pass or fail. And the lot number and analysis date, which connect the measurement to the container in hand. A single number with none of these is an assertion rather than a result.
Where to read next
- Purity versus identity for research labs why an area percentage and a mass match answer different questions
- Reading an HPLC chromatogram: purity by area where the separation happens before the spectrometer sees anything
- How to review a peptide certificate of analysis the full field-by-field walkthrough of the document
- Lot traceability: matching label, COA and records connecting a spectrum to the container it is supposed to describe
- Third-party lab testing and COAs
All materials referred to here are supplied strictly for laboratory research use. They are not drugs, foods, cosmetics or medical devices, and they are not for human or veterinary use, diagnostic use, or any form of consumption. Nothing in this guide is guidance on acquiring, preparing or handling any compound outside a controlled research setting. The analytical descriptions are general explanations of common instrumentation and are not a substitute for a qualified analyst evaluating a specific spectrum against a specific sequence.